
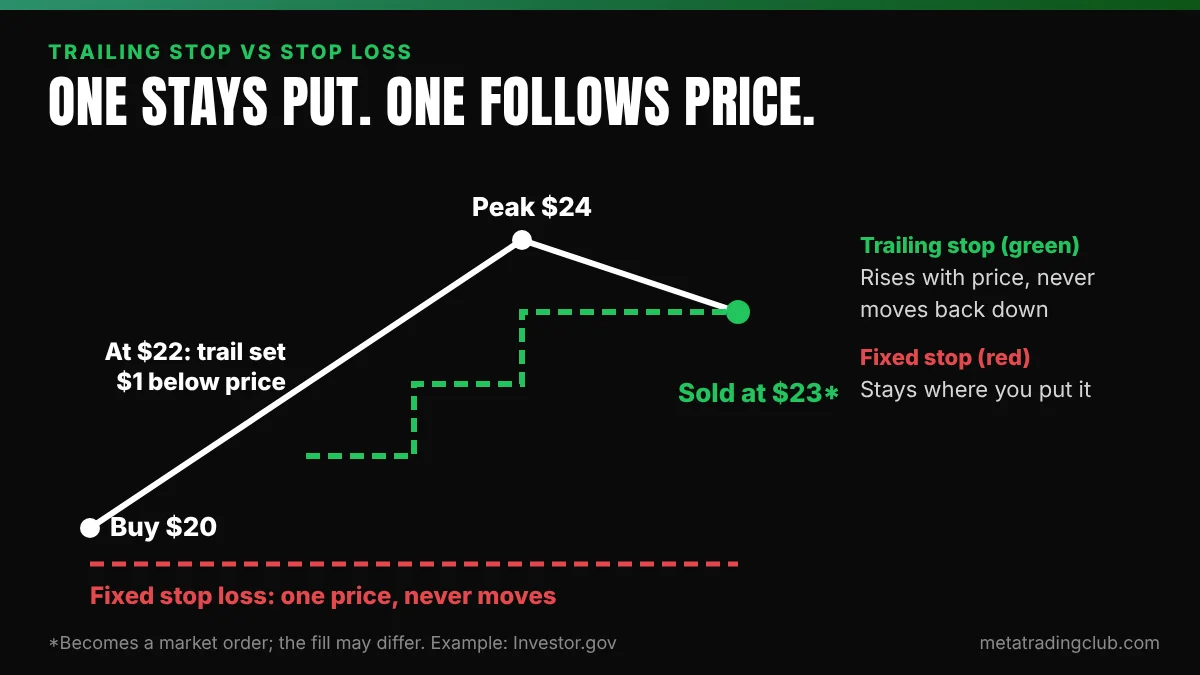
Trailing stop vs stop loss comes down to one thing: does your exit stay put or follow price? A fixed stop loss sits at one price until it is hit or you move it. A trailing stop moves up behind a winning long by a set percentage or dollar amount and never moves back down.
Neither one is “better.” Below we run both on the same hypothetical trade, in R, so you can see where each one wins and where it costs you.
Key takeaways
- A fixed stop loss defines your risk (1R) and stays put. A trailing stop follows price in your favour and stays fixed when price moves against you.
- Both become market orders when triggered, so neither guarantees your exit price.
- A trail gives back less in a smooth trend or a fast failure. It chokes a trend that pulls back deeper than the trail.
- Trails come in four flavours: percentage, dollar, ATR and structure. Only structure trails off what the chart is actually doing.
- At Meta Trading Club we place the first stop beyond the Zone and only trail once the move has confirmed, swing by swing.
What is the difference between a trailing stop vs stop loss?
A stop loss (also called a stop order) is an instruction to sell once price reaches a level you pick. Investor.gov puts it plainly: when the stop price is reached, a stop order becomes a market order. On a long trade the sell stop sits below the current price. If you are new to the basics, our pillar guide on what a stop loss is covers the full picture.
A trailing stop is the same kind of order with one twist. The stop price is not a fixed number. It is set as a percentage or dollar amount below the market price, and it ratchets up as price rises. If price falls, the trailing stop price stays where it is. FINRA describes it the same way: you sell if the stock drops a certain percentage or dollar amount from its price at the moment.
Investor.gov gives a simple example. You buy at $20. Price rises to $22 and you place a sell trailing stop $1 below the market. Price peaks at $24, so the stop sits at $23. Price drops, the stop stays at $23, and the shares are sold when price reaches $23, though the fill may be different from $23.
| Feature | Fixed stop loss | Trailing stop |
|---|---|---|
| Stop price | One price you choose | A % or $ distance from the market price |
| Moves? | Only if you move it | Up automatically with a long; never back down |
| When triggered | Becomes a market order | Becomes a market order (or a limit order on a trailing stop-limit) |
| Main job | Cap the loss at 1R | Lock in open profit as the trade works |
| Best market | Range-bound or target-based trades | Smooth trends |
| Main weakness | Can hand back a big open gain | Short-term wiggles can trigger it early |
How do a fixed stop and a trailing stop compare on the same trade?
Let’s take one long trade and run three exit plans on three price paths. Everything is in R, where 1R is the distance from entry to the first stop, so the lesson holds at any account size.
MTC Analysis · Hypothetical example
One entry, three exit plans, three price paths
Long entry at $100.00. First stop at $98.00, just beyond the Zone. Risk per share = $2.00, so 1R = $2.00.
- Plan A, fixed stop + target: stop stays at $98.00, exit at a 3R target of $106.00.
- Plan B, 3% trailing stop: stop = the higher of $98.00 or highest price × 0.97.
- Plan C, structure trail: stop stays at $98.00 until a higher low forms and the prior high breaks, then sits $0.20 under that higher low.
Path 1, smooth trend. Price climbs to $110.00 with small dips, the last higher low is $107.00, then price drops hard.
- A: target hit at $106.00 → ($106.00 − $100.00) ÷ $2.00 = +3R
- B: $110.00 × 0.97 = $106.70 → $6.70 ÷ $2.00 = +3.35R
- C: $107.00 − $0.20 = $106.80 → $6.80 ÷ $2.00 = +3.40R
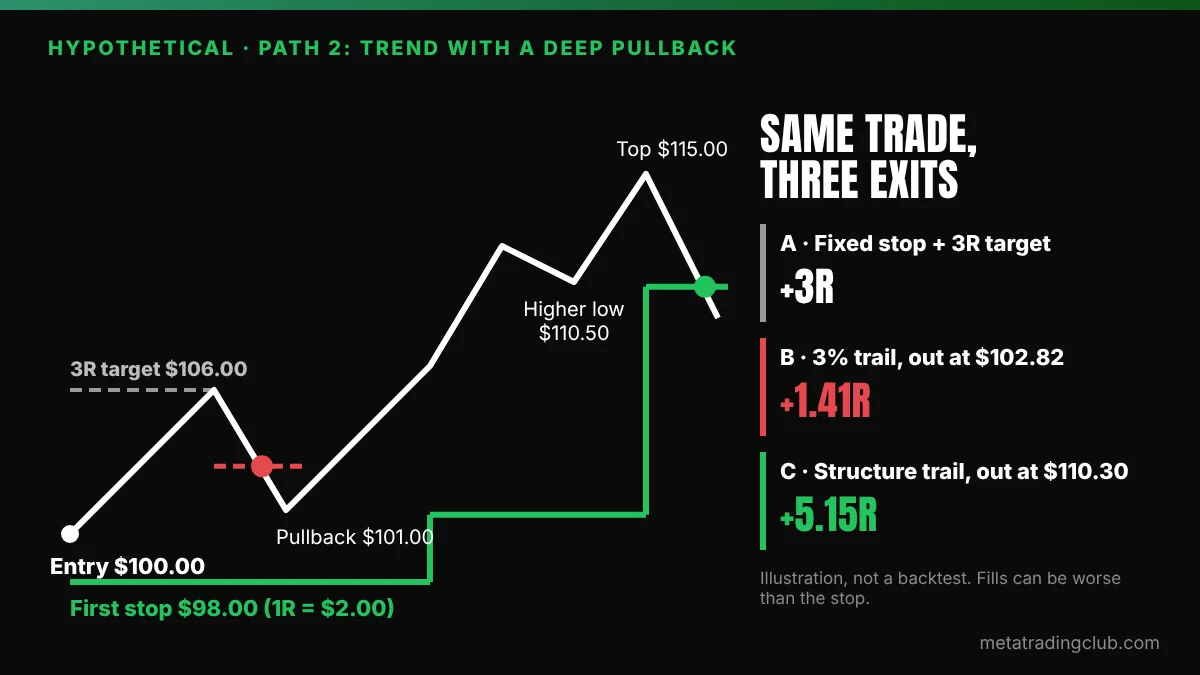
Path 2, trend with a deep pullback. Price runs to $106.00, pulls back to $101.00 (a higher low), breaks above $106.00, sets a higher low at $110.50, tops at $115.00, then drops.
- A: target hit at $106.00 on the first leg → +3R
- B: $106.00 × 0.97 = $102.82. The pullback to $101.00 triggers it → $2.82 ÷ $2.00 = +1.41R, and the rest of the trend happens without you.
- C: the $98.00 stop holds through the pullback. After the break above $106.00 it moves to $100.80, then to $110.30 → $10.30 ÷ $2.00 = +5.15R
Path 3, fast failure. Price pops to $102.00, then reverses straight down to $97.00.
- A: stop at $98.00 → −1R
- B: $102.00 × 0.97 = $98.94 → −$1.06 ÷ $2.00 = −0.53R
- C: no higher low yet, so the stop is still $98.00 → −1R
These are three paths drawn to show trade-offs, not a backtest. Real fills can be worse than the stop, especially on a gap.
Notice that every plan wins somewhere. The fixed target banks a clean +3R and ignores everything after. The 3% trail is the best loser in Path 3 and a fine winner in Path 1, but it gets shaken out of the best trade on the board in Path 2. The structure trail takes the full −1R on the failure, then catches the trend because it only tightens when the chart says so.
When does a trailing stop give back less, and when does it choke a trend?
A trailing stop gives back less in two situations. The first is a smooth trend whose pullbacks stay smaller than the trail, like Path 1. The second is a trade that pops then fails fast, like Path 3: the trail has already moved up a little, so the loss is smaller than a full 1R.
It chokes a trend when normal pullbacks are deeper than the trail distance. In Path 2 the pullback from $106.00 to $101.00 was a healthy higher low on the chart. To a 3% trail it was just a number crossing a line. Investor.gov warns about exactly this: short-term market fluctuations can activate a trailing stop, so the trail distance needs care.
What types of trailing stop are there?
- Percentage trail. The stop sits a fixed percentage under the highest price. Simple, but it ignores how much the instrument normally moves.
- Dollar (points) trail. The stop sits a fixed dollar amount under the high, as in the Investor.gov $1 example. Easy to read, but the same dollar trail means very different things on a cheap stock and an expensive one.
- ATR trail. The distance is a multiple of the Average True Range, so it widens when the market gets more volatile and tightens when it calms down. Better than a flat number, but still a formula that knows nothing about where the swing lows are.
- Structure trail. You move the stop under each new higher low (or above each lower high on a short) once the market proves it by breaking the prior swing. It follows the trend itself, but it is manual and you need to read a break of structure correctly.
Brokers offer the first two as automatic orders. The last two you apply yourself by moving a regular stop.
How do brokers handle trailing stop orders?
Mechanics vary by firm, so read your broker’s help page. What we confirmed on official pages (checked November 2026):
- Not every broker offers them. Investor.gov notes that stop, stop-limit and trailing stop orders may not be available through all brokerage firms, and that firms use different standards to decide when a stop price has been reached.
- The stop price is not your fill. Both Investor.gov and FINRA explain that a triggered stop becomes a market order, and the fill can differ from the stop price, especially in fast markets. A gap through your stop fills at the next available price. Our guide on stop loss vs stop limit shows what happens on a gap.
- Some trails live on the broker’s servers. Fidelity says its trailing stops are held on a separate internal order file, are only monitored between 9:30 a.m. and 4:00 p.m. Eastern, and carry extra risk in volatile markets because they rely on trigger pricing.
The mistake we see most
Traders set a tight trailing stop the second they enter because it “feels” safer. It isn’t. Before the trade has room, a tight trail is just a smaller stop with a fancier name, and noise shakes you out.
Your first stop is about being wrong. Your trail is about being right. Keep those two jobs separate.
How do we place stops at Meta Trading Club?
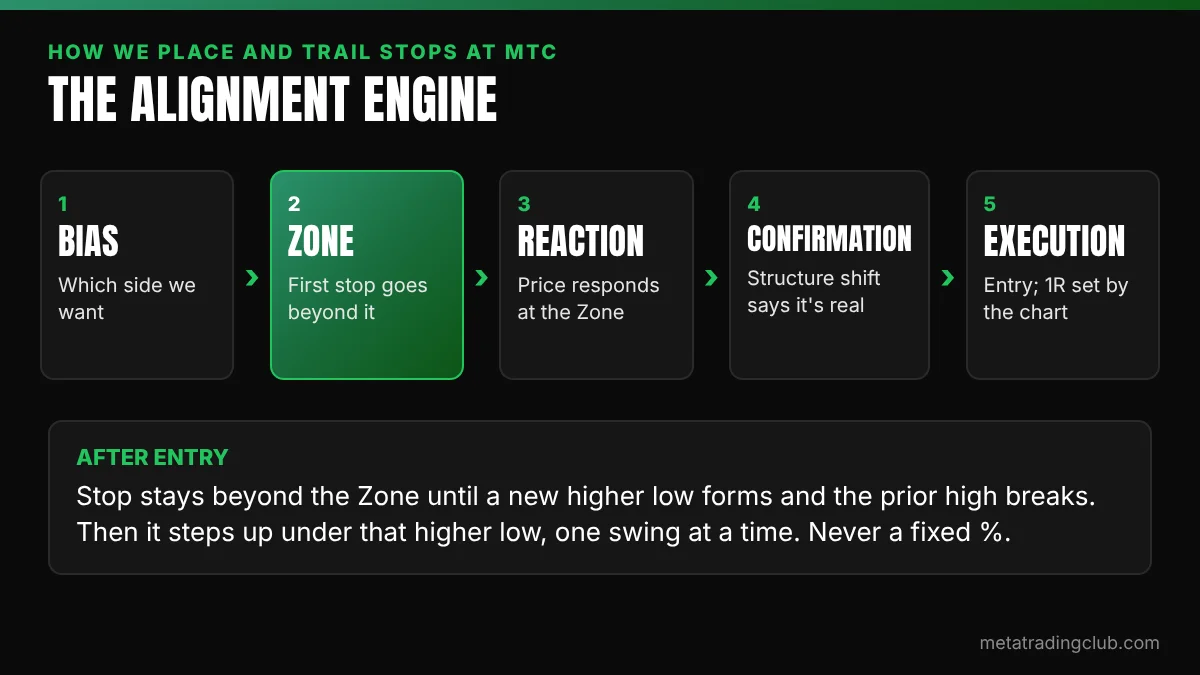
Every trade we teach runs through the Alignment Engine: Bias → Zone → Reaction → Confirmation → Execution. The stop plan is built into those steps, not bolted on afterwards.
- Bias tells us which side we want.
- Zone is the area where we expect buyers or sellers to show up. The first stop goes beyond the far edge of the Zone. If price trades through it, the idea is wrong.
- Reaction is price actually responding at the Zone. No reaction, no trade.
- Confirmation is the structure shift that tells us the reaction is real.
- Execution is entry, with the stop beyond the Zone, so 1R is set by the chart and size follows from it. Our position size calculator does that maths for you.
After entry, the stop does not trail on a percentage. It stays beyond the Zone until the move confirms in our favour: a new higher low, then a break of the prior high. Only then does it step up under that higher low, one swing at a time. That is Plan C above. We go deeper on stop placement in how to set a stop loss the right way.
This is how we teach it at Meta Trading Club, where 600+ traders have trained since we started in Toronto in November 2021. We grade every setup that passes the five steps with Qualification (A+, A or B), and the grade sets the risk per trade. In premarket prep every market day and live sessions four days a week (Mon, Tue, Thu, Fri), we mark the Zone and the invalidation before we talk about any trail. Our track record is logged in R (1R = 2% account risk).
Should you use a trailing stop or a fixed stop loss?
Use a fixed stop loss to define the risk on every trade, always. Then decide how you exit a winner:
- If the move usually runs to a clear area and stalls, a fixed target can make more sense than a trail.
- If you can’t watch the screen, an automatic trail set wider than normal pullbacks can protect open profit.
- If you can watch the chart, a structure trail after confirmation gives the trade room and still locks in gains.
Whatever you choose, write it down before entry.
Frequently asked questions
Sources: Investor.gov (SEC), Investor Bulletin: Stop, Stop-Limit, and Trailing Stop Orders; FINRA, Order Types; Fidelity, Trailing stop orders. Broker and order-type details checked November 2026.
Featured image: Chicago Board of Trade by Warren LeMay (CC BY-SA 2.0), Wikimedia Commons, AI-edited
Education only. Not financial advice.