Every guide on this page teaches one system. Five steps decide if a trade is real. Then Qualification grades it, and the grade decides how much you risk. Trades are qualified, not taken.
NYSE trading floor. Photo: Carol M. Highsmith / Library of Congress, via Wikimedia Commons (public domain). Colour grade by MTC.
How do you learn to trade the MTC way? Learn one process and run it on every trade. Read the market Bias, find the Zone, wait for a Reaction, demand Confirmation, then plan Execution. A setup that passes all five gets a Qualification grade. The grade sets your risk. No alignment, no trade.
The whole process on one page
Five checks in a fixed order. Fail one and you stop. Pass all five and the setup gets a grade. The grade sets the risk.
1 · BiasWho is in control?
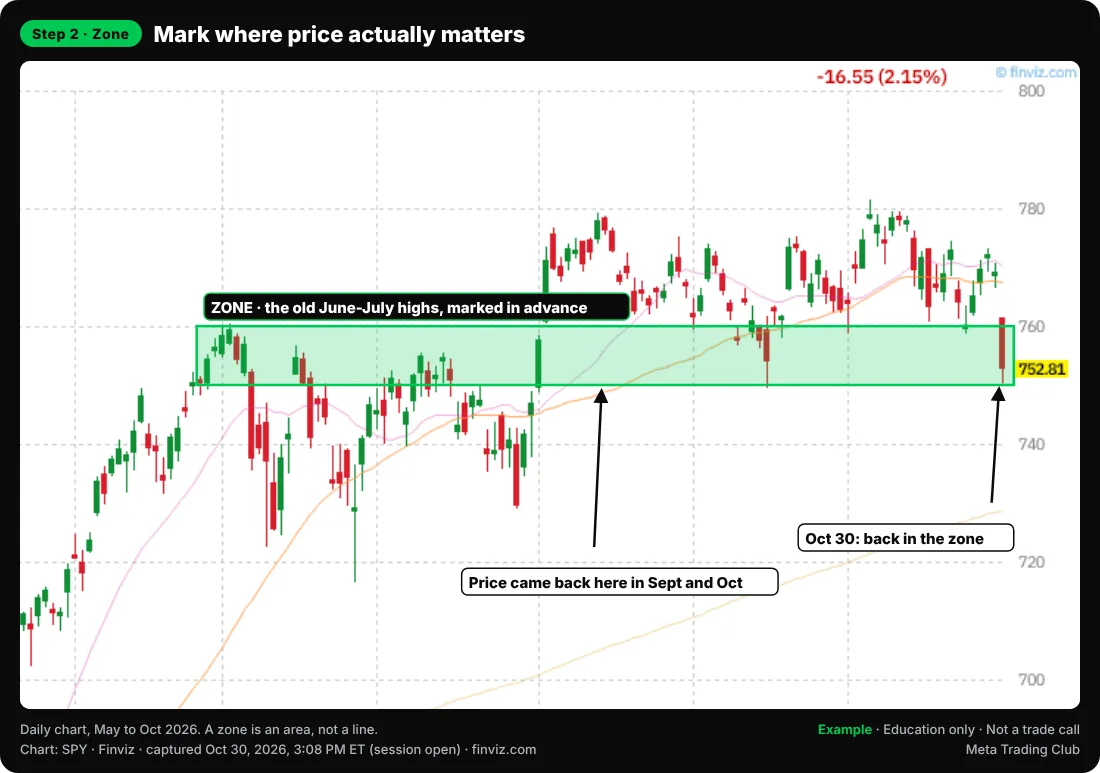
2 · ZoneWhere does it matter?
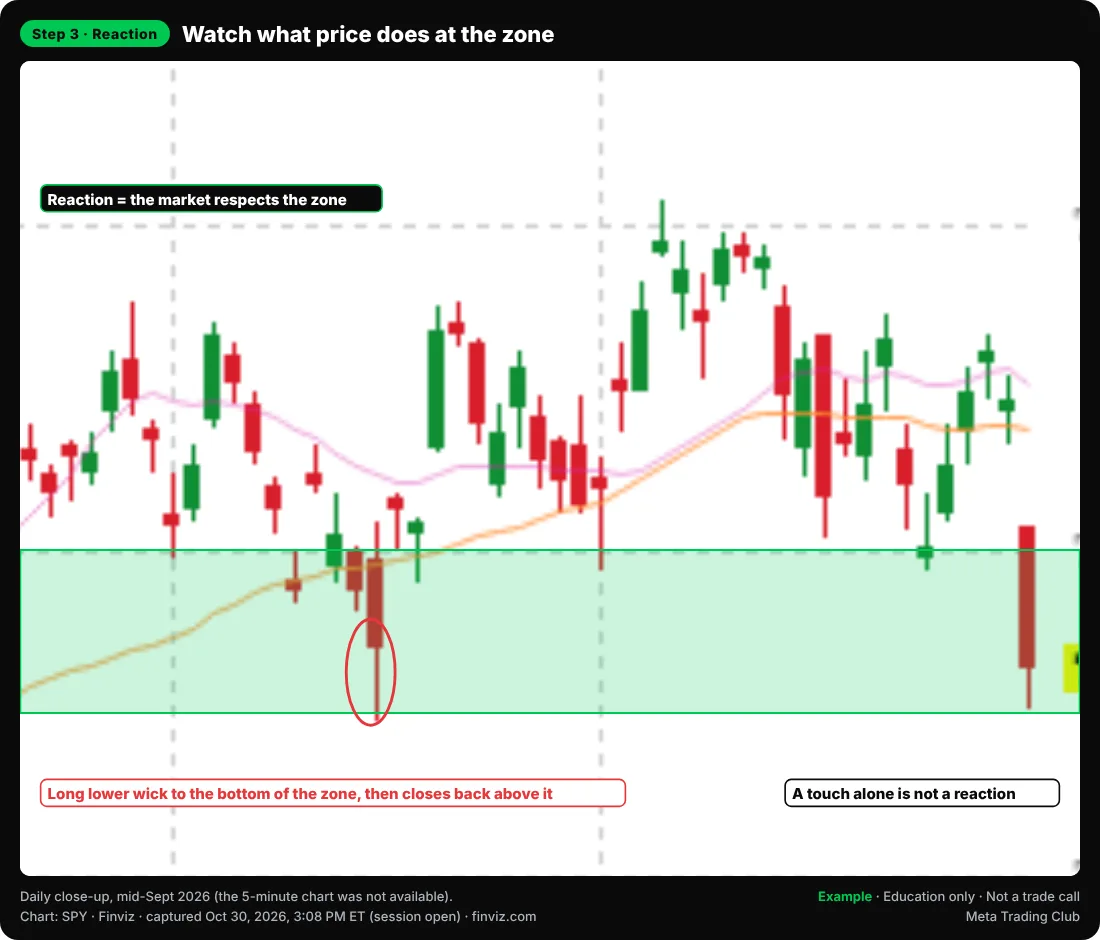
3 · ReactionDoes it respect the zone?
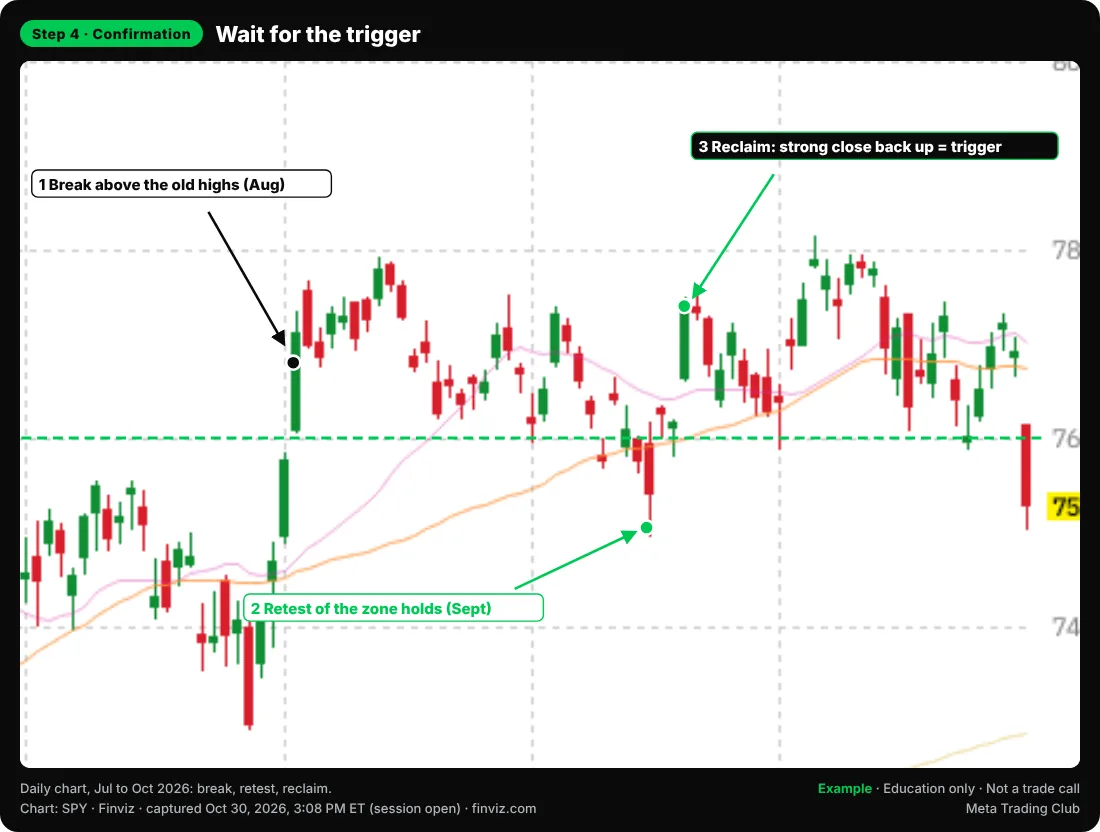
4 · ConfirmationDid a trigger fire?
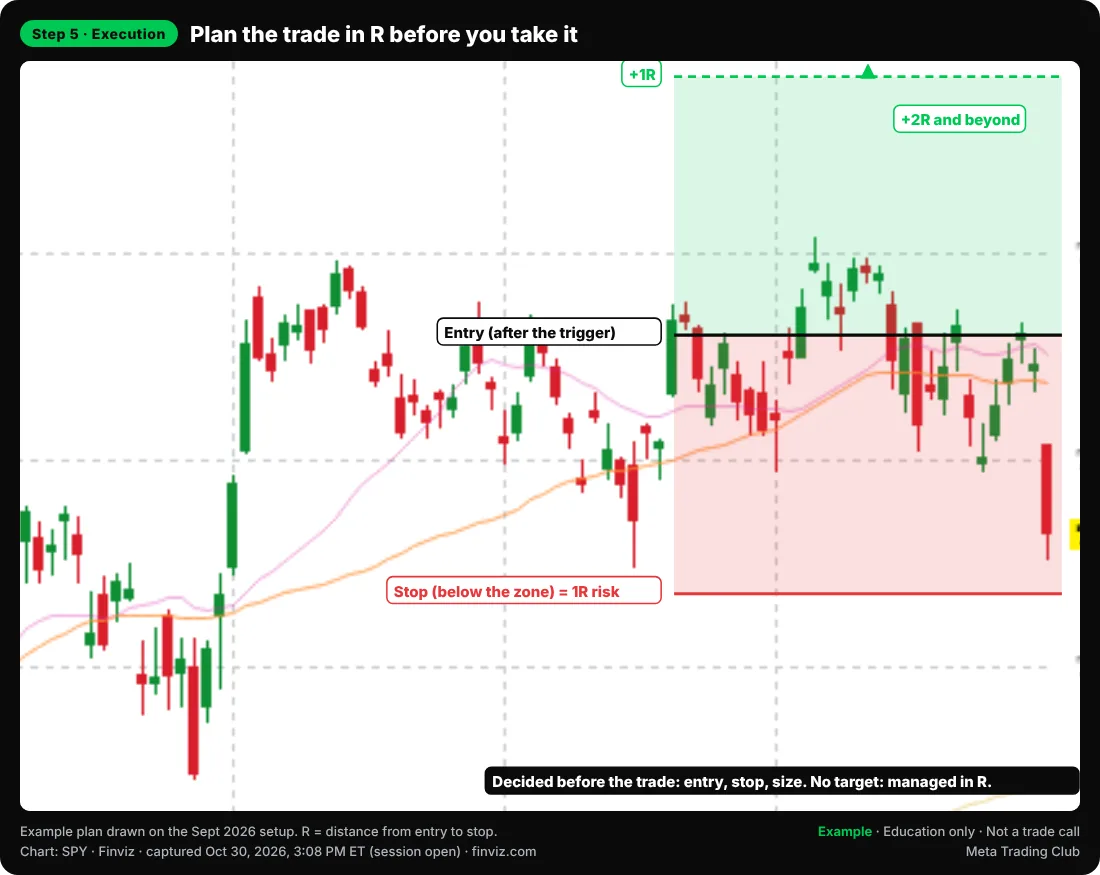
5 · ExecutionEntry, stop, size
Qualification: A+ · A · BThe grade sets the risk per trade
Fail any step = no trade
Start here
Three foundations. Read these first. Everything else on the site builds on them.
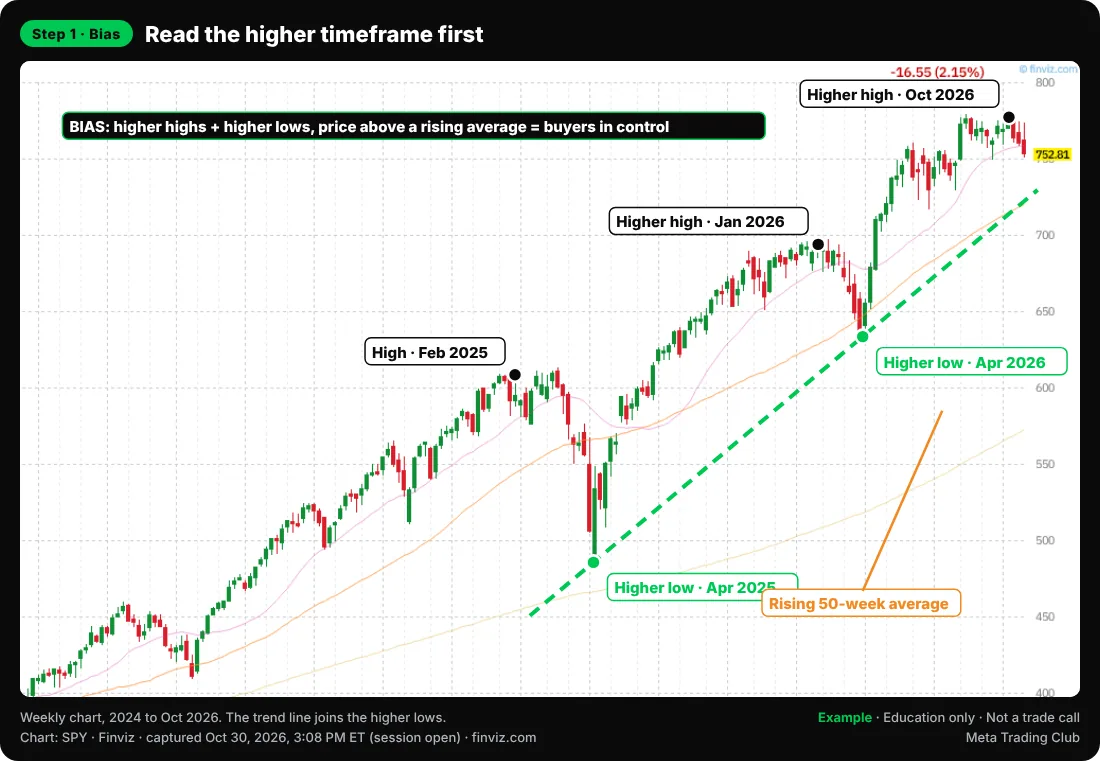
Every chart below is SPY (the S&P 500 ETF), captured from Finviz on Oct 30, 2026 at 3:08 PM ET, while the session was still open. They show how each step looks in practice. They are examples for learning, not trade calls.
1
Bias
Who is in control on the higher timeframe?
Start on the weekly chart, not the 5-minute.
Higher highs and higher lows mean buyers are in control.
Passing the five steps gets a setup in the door. Qualification decides how good it is. The grade sets your risk: higher grade, more risk allowed. Lower grade, less.
A+Everything lines up
Every step is clear and they all point the same way. The trade the whole process waits for.
AStrong, one soft spot
All five steps pass, but one is less clean. Still a trade, with less risk than an A+.
BPasses, barely
The edges are soft. Smallest risk, or wait for a better one.
Risk per trade by grade
Example · illustrative, not an MTC rule or a recommended percentage.
You do not need to win most of your trades. You need your winners to be big enough compared with your losers. This chart is plain math, not MTC results.
The black line is break-even. At 1R you need to win half your trades just to stay flat. At 2R you only need a third. At 3R, a quarter.
The math: expectancy = (win rate × average win in R) − (loss rate × 1R). A trader who wins 40% of the time at 2R makes +0.2R per trade on average. A trader who wins 60% of the time at 0.5R loses 0.1R per trade.
Co-Founder & CEO of Meta Trading Club in Toronto, with 8+ years of trading. We at Meta Trading Club have trained 600+ traders and trade live every market day, using the same five steps on this page.
What are the five steps of the MTC Alignment Engine?
Bias, Zone, Reaction, Confirmation and Execution, in that order. Bias reads who controls the higher timeframe. Zone marks where price matters. Reaction checks the market respects that zone. Confirmation waits for a real trigger. Execution sets entry, stop and size before the trade.
What is Qualification in trading?
Qualification grades a setup that already passed all five steps, as A+, A or B. The grade sets how much you risk on the trade: a higher grade allows more risk, a lower grade less. It stops you sizing every trade the same.
What does 1R mean?
1R is the amount you lose if your stop is hit: the distance from entry to stop, times your size. Measuring results in R lets you compare trades of any size and see if your winners are big enough to pay for your losers.
Where should I start if I am new to trading?
Start with the Trade Qualification framework, keep the glossary open, and print the day trading checklist. Then take the free lesson to see one trade run through every step on a real chart.