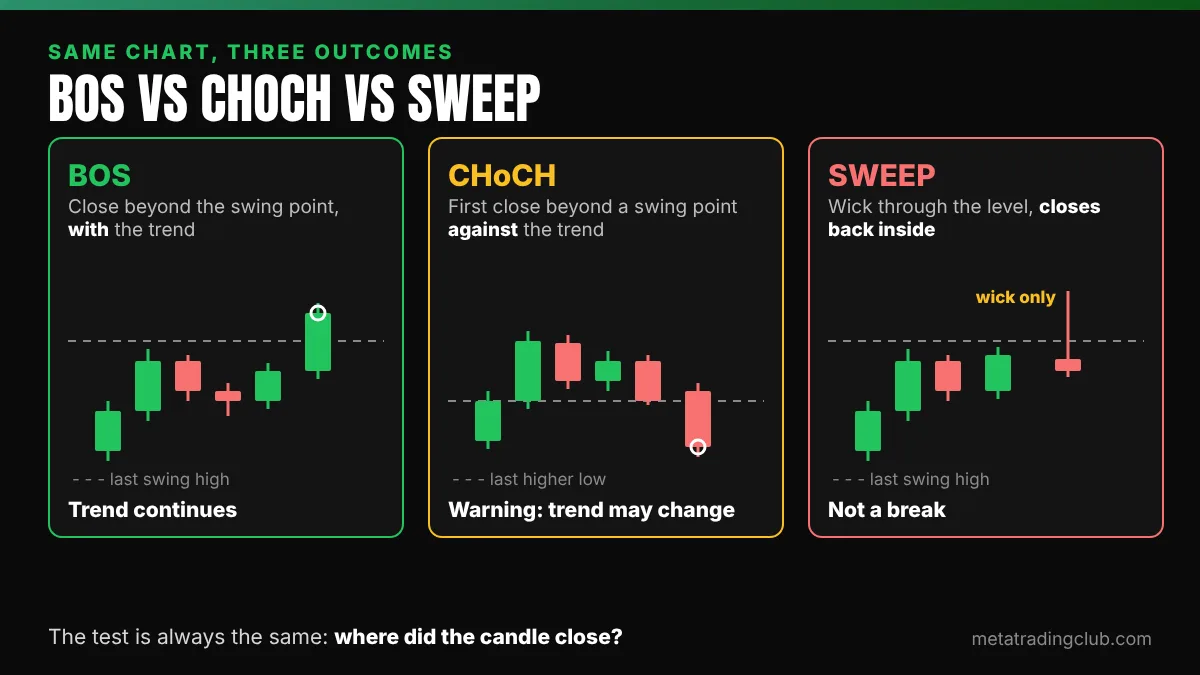
A break of structure (BOS) is a candle that closes beyond the last swing point in the direction of the trend: above the last swing high in an uptrend, or below the last swing low in a downtrend. It tells you the trend is still in charge. A wick through the level without a close is not a break.
That one rule, the candle close, clears up most of the confusion. Here is how to spot a real break, how it differs from a change of character and a sweep, and how to trade it without chasing.
Key takeaways
- A break of structure is a candle close beyond the last swing high (uptrend) or swing low (downtrend). A wick alone does not count.
- BOS goes with the trend. A change of character (CHoCH) is the first close against it.
- A wick through a swing point that closes back inside is a sweep, not a break.
- In our Alignment Engine, the break is the Reaction. We wait for Confirmation (a retest that holds) before Execution.
What is a break of structure in trading?
Start with what a trend is. Fidelity’s learning center puts it plainly: an uptrend is made up of ascending peaks and troughs, meaning “higher highs and higher lows,” and a downtrend is “lower highs and lower lows” (Fidelity). Those peaks and troughs are what traders call structure.
A break of structure is the moment price proves the pattern is still going. In an uptrend, the market pulls back, makes a higher low, then pushes up and closes above the previous high. That close is the BOS. In a downtrend it is the mirror image: a lower high, then a close below the previous low.
So a BOS does not point to a reversal. It points to continuation. If you want the wider picture of how highs, lows and trends fit together, our market structure guide is the place to start.
How do you mark swing highs and swing lows?
Most BOS mistakes come from sloppy swing points. Keep it simple:
- A swing high is a peak with lower highs on both sides of it. Price went up, stopped, and turned down.
- A swing low is a trough with higher lows on both sides. Price went down, stopped, and turned up.
- Only mark the swings that matter. If you have to squint, it is noise on that timeframe.
- Update as you go. Once a new high is confirmed by a break, the higher low that came right before it becomes the line the trend must defend.
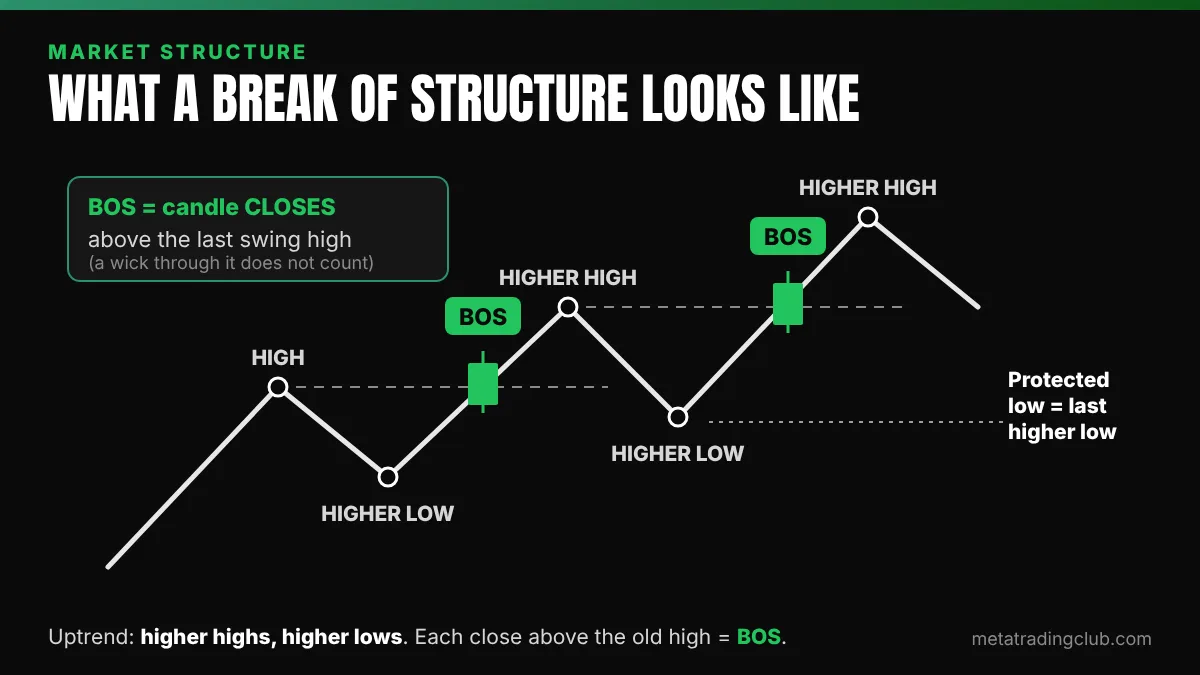
In an uptrend, every BOS leaves a “protected” higher low. While price stays above it, the structure is intact.
Why does the candle close matter so much?
Because wicks lie. Price often pokes above an obvious high, triggers the orders resting there, then snaps back inside the range before the candle finishes. Live, that spike looks exactly like a breakout.
This is what traders call a liquidity sweep: price runs through a swing point to take out the stops and pending orders sitting just beyond it, then reverses. Nothing about the trend changed. The level was tested, not broken.
CME Group’s education material makes a useful point here: support and resistance “will not always hold to the penny” and work more like zones than exact prices (CME Group). That is why we judge a break by the close, not by the first tick through. A close means the new ground held for the whole candle. A wick means it didn’t.
If you keep getting caught by fake moves, our guide on reversal vs breakout walks through how to tell the two apart in real time.
A wick is a test. A close is a break.
What is the difference between BOS and a change of character?
A change of character (CHoCH) is the first close beyond a swing point against the trend. In an uptrend, that means a close below the last higher low, the one each BOS left behind. It is the first time in the trend that sellers have held price below a low buyers had defended.
A CHoCH is a warning, not a verdict. Fidelity says the same about trendlines: when one is broken, “it should serve only as a warning that the trend may be changing” (Fidelity). We treat a CHoCH the same way. We stop looking for trades in the old direction and wait for new structure to form.
Here is all three side by side:
| Break of structure (BOS) | Change of character (CHoCH) | Liquidity sweep | |
|---|---|---|---|
| What happens | A candle closes beyond the last swing point with the trend | The first candle close beyond a swing point against the trend | Price pokes through a swing point, then closes back inside |
| In an uptrend | Close above the last swing high | Close below the last higher low | Wick above the high (or below the low), close back inside the range |
| Candle close beyond the level? | Yes | Yes | No |
| What it suggests | The trend is still in charge | The trend may be changing; a warning, not proof | Orders above or below the level got taken, and the move did not hold |
| What we do next | Mark the new Zone and wait for a retest | Stop trading the old direction; wait for new structure | Do not treat it as a break; watch for a move the other way |
Which timeframe should you use to spot a break?
There is no magic timeframe. Read structure on more than one, and know which one is in charge.
- Higher timeframe for Bias. The 1-hour, 4-hour or daily chart tells you the direction. A BOS there carries more weight.
- Lower timeframe for the trigger. The 5- or 15-minute chart shows the break and the retest you will act on.
- Judge the close on the timeframe you trade. A 1-minute close above a level is not a 15-minute close above it.
The cleanest setups line up: the higher timeframe is trending, and the lower timeframe breaks in the same direction. Our multiple time frame analysis guide shows how to stack them.
How do you trade a break of structure without chasing?
A break on its own is not a trade. At Meta Trading Club, every setup has to pass the five steps of our Alignment Engine, in this order: Bias → Zone → Reaction → Confirmation → Execution. Here is where a break of structure fits:
- Bias. Is the higher timeframe making higher highs and higher lows, or lower highs and lower lows? We only trade breaks in that direction.
- Zone. Mark the area around the swing point that is about to break. That band is where we will look for the retest later.
- Reaction. The break of structure itself: a candle closes beyond the swing point. This is the market reacting at the Zone.
- Confirmation. Price comes back to the broken Zone and holds. Old resistance acts as support (or the other way round in a downtrend). No hold, no trade.
- Execution. We enter only after the confirmation candle closes, with the stop on the far side of the Zone and the next level in the trend’s direction as the place we plan to take profit.
The Confirmation step leans on an old idea. CME Group notes that when a level breaks, support becomes resistance and resistance becomes support (CME Group). The retest is how you check that the flip actually happened. We cover it in detail in what is a retest in trading.
Here is the whole sequence with numbers.
MTC Analysis · Hypothetical example
An uptrend break, traded on the retest
Made-up prices on a 15-minute chart to show the arithmetic. Not a real trade and not a level on any ticker.
- Bias: the 1-hour chart prints higher highs and higher lows. We only look for longs.
- Zone: the last swing high sits at 102.00. The area from 101.60 to 102.00 has capped price before, so that band is our Zone.
- Reaction: a 15-minute candle closes at 102.60, above 102.00. That is the break of structure.
- Confirmation: price pulls back to 101.80, inside the Zone, and the next candle closes back up at 102.30. The old ceiling held as a floor.
- Execution: entry 102.30. Stop 101.40, on the far side of the Zone (101.60 minus a small buffer). Target 104.10, the next higher-timeframe level.
| Risk per share (1R) | 102.30 − 101.40 = 0.90 |
| Reward per share | 104.10 − 102.30 = 1.80 |
| Reward to risk | 1.80 ÷ 0.90 = 2.0 |
| If the target fills | +2R |
| If the stop fills | −1R |
Now compare the chase. Buying the break candle at 102.60 with the same stop at 101.40 means 1.20 of risk for 1.50 of reward. That is 1.25R if it works. Same idea, worse trade.
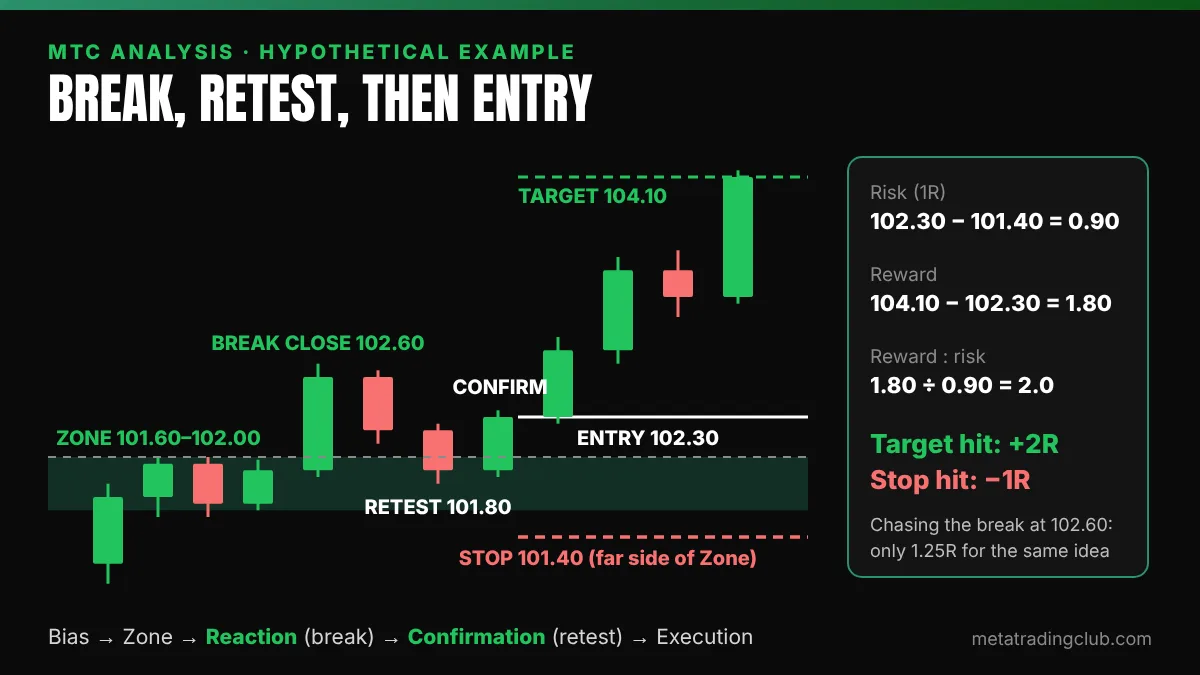
The stop sits on the far side of the Zone because the Zone is the idea: if price closes back below it, the flip failed. And the result is in R, so the lesson holds at any account size.
The expensive part is the chase
The break candle is usually the biggest, fastest candle on the screen. Buy it, and your stop sits far below, so the same target pays less for more risk.
The retest gives you the opposite: a tighter stop, a clear place to be wrong, and proof the level flipped. If price never comes back, you missed one trade. That costs nothing.
What are the most common break of structure mistakes?
- Calling a wick a break. Wait for the close.
- Marking every tiny swing. You will see a “break” every few candles and none of them will mean anything.
- Trading breaks against the higher timeframe. A 5-minute BOS inside a daily downtrend is usually a pullback, not a new trend.
- Entering on the break candle. As the example shows, the chase can shrink your reward-to-risk by a lot.
How we teach market structure at Meta Trading Club
We started Meta Trading Club in Toronto in November 2021, and we’ve trained 600+ traders since. I’ve been trading for 8+ years, and structure is one of the first things we teach, because every other step depends on it.
In premarket prep every market day, we mark swing points and Zones before the open. In live trading sessions (Monday, Tuesday, Thursday and Friday), we wait for the Reaction and Confirmation in real time. A setup that passes all five steps gets a Qualification grade (A+, A or B), and the grade sets how much we risk on it. Every trade in our track record is logged in R. Our support and resistance guide covers how we draw the Zones themselves.
Frequently asked questions
Sources: Fidelity, Basic concepts of trend (definitions of uptrends, downtrends and broken trendlines as a warning); CME Group, Support and Resistance (support and resistance as zones; broken support becomes resistance and vice versa). Pages opened November 2026. BOS, CHoCH and sweep are trading-community terms, not from these sources.
Featured image: AI-edited from a photo of the Wall St street sign by Alex Proimos (Wikimedia Commons, CC BY 2.0).
No alignment, no trade.
Education only. Not financial advice. The worked example uses hypothetical prices and is not a trade call on any security.