A liquidity sweep is when price pushes just past an obvious high or low, where stop orders and breakout orders sit, fills those orders, and then reverses back inside the range. The push looks like a breakout. The quick return inside is what tells you it was a sweep, not a new move.
Traders also call it a stop run or a stop hunt. It is one of the most common reasons a “perfect” stop gets hit right before price goes the way you expected.
Key takeaways
- A sweep is a quick push through an obvious high or low that closes back inside. A breakout holds outside.
- It happens because resting stop orders turn into market orders when their price is touched, and those orders get filled in a burst.
- The close back inside, follow-through and the retest tell you more than the wick itself.
- In the Alignment Engine, a sweep is a Reaction at a Zone. It is never an entry on its own. We wait for Confirmation.
- Stops parked just past an obvious low sit right where sweeps happen. Placing the stop beyond the Zone and sizing down keeps the dollar risk the same.
What is a liquidity sweep, in plain English?
Picture a stock that has bounced off the same price three times this morning. Everyone can see that low. Buyers who went long near it put their stop-loss orders a few cents below it. Breakout sellers put sell-stop orders there too, waiting to go short if the low breaks.
That creates a pile of orders sitting just under one obvious price. In this context, “liquidity” simply means orders waiting to be filled. When price trades through that low, those orders go off. Price prints a wick below the low, then comes back up and closes inside the old range. That wick-and-return is the sweep.
The same thing happens in reverse at an obvious high: price pokes above it, fills the buy stops of short sellers and the breakout buyers, then falls back inside.
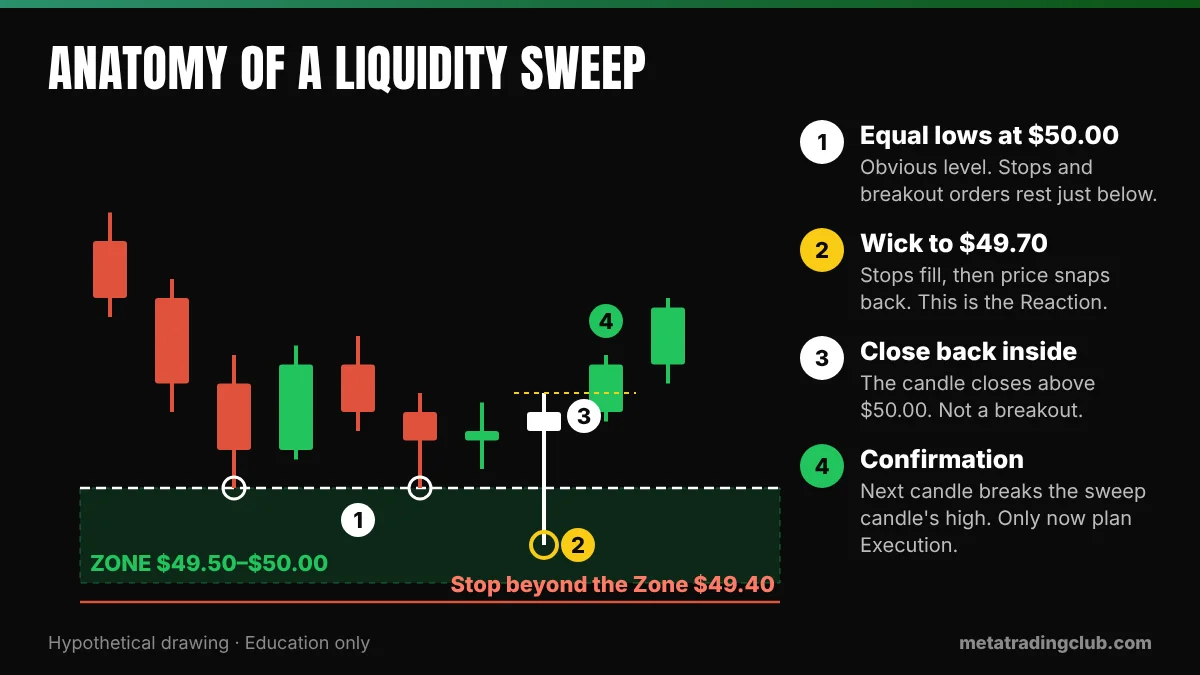
Three things define it on a chart:
- An obvious level. Equal lows, equal highs, a prior day high or low, a round number.
- A push just past it. Usually a wick, not a long body. Price spends little time outside.
- A close back inside. The candle (or the next one) closes back on the original side of the level.
If you are new to finding those levels, our guide to support and resistance trading shows how we mark them as Zones rather than thin lines, which matters a lot here.
Why does a liquidity sweep happen?
The mechanics come straight from how stop orders work. A stop order does not lock in your exit price. According to Investor.gov, when your stop price is reached, the stop order becomes a market order, and the price you get may differ from the stop price, especially in a fast-moving market.
FINRA says the same thing in its guide to stop orders in volatile markets: a stop becomes a market order once the stop price is reached, and rapid price movement over a short period can trigger it. The SEC’s investor bulletin on stop orders adds that a stop can be triggered by a short-term, intraday price move, and that the fill can deviate significantly from the stop price depending on the liquidity available.
Now put many of those orders at the same price. When the low trades, sell-stops from longs and sell-stops from breakout shorts all turn into market sell orders at once. That burst of selling can push price a little further, which is why the wick often extends past the level. Buyers waiting lower get filled against it. Once the stops are used up, there is no fresh selling left, and price can snap back inside.
That is the observable part: orders clustered at an obvious price, a burst of fills, then a return. If you want to go a level deeper into reading who is buying and selling, see our honest look at order flow trading.
Is a liquidity sweep the same as a stop hunt?
Mostly, yes, in how people use the words. “Liquidity sweep,” “stop hunt” and “liquidity grab” are popular terms in ICT (Inner Circle Trader) and SMC (Smart Money Concepts) content. They describe the same chart behavior.
Where we stay careful is the story attached to it. You will hear that big institutions deliberately “hunt” retail stops. You cannot see intent on a chart, so we do not present it as fact. What you can observe is simpler: orders cluster at obvious prices, they become market orders when touched, and price sometimes reverses once they are filled. You do not need a villain to explain it.
The sweep shows you where the orders were; Confirmation shows you who is in control now.
How do you tell a sweep from a real breakout?
A move through a level can turn into three different things. A breakout holds outside and keeps going. A failed breakout closes outside, then gets pulled back in later. A sweep barely spends time outside and closes back in fast. Here is how we compare them:
| What to check | Liquidity sweep | Real breakout | Failed breakout |
|---|---|---|---|
| Close vs the level | Closes back inside, often on the same candle | Closes outside and stays outside | Closes outside first, then back inside a few candles later |
| Volume | A spike on the push through, then fades as price returns | Strong and keeps coming as price moves away | Strong on the break, then dries up as price stalls |
| Follow-through | Little or none past the level | Next candles extend in the break direction | One or two candles, then it stalls |
| Retest | Old level acts in the original direction again | Old level flips: support becomes resistance, or the reverse | Retest fails and price returns into the range |
| What it means for us | Possible Reaction at a Zone. Wait for Confirmation. | The level is broken. Watch the retest. | Trapped breakout traders. Treat with care either way. |
The retest row is where most of the answer lives. A real breakout usually comes back to test the broken level from the other side and holds. We cover that in depth in our pillar guide, what is a retest in trading. For the bigger picture of telling turns from continuations, see reversal vs breakout.
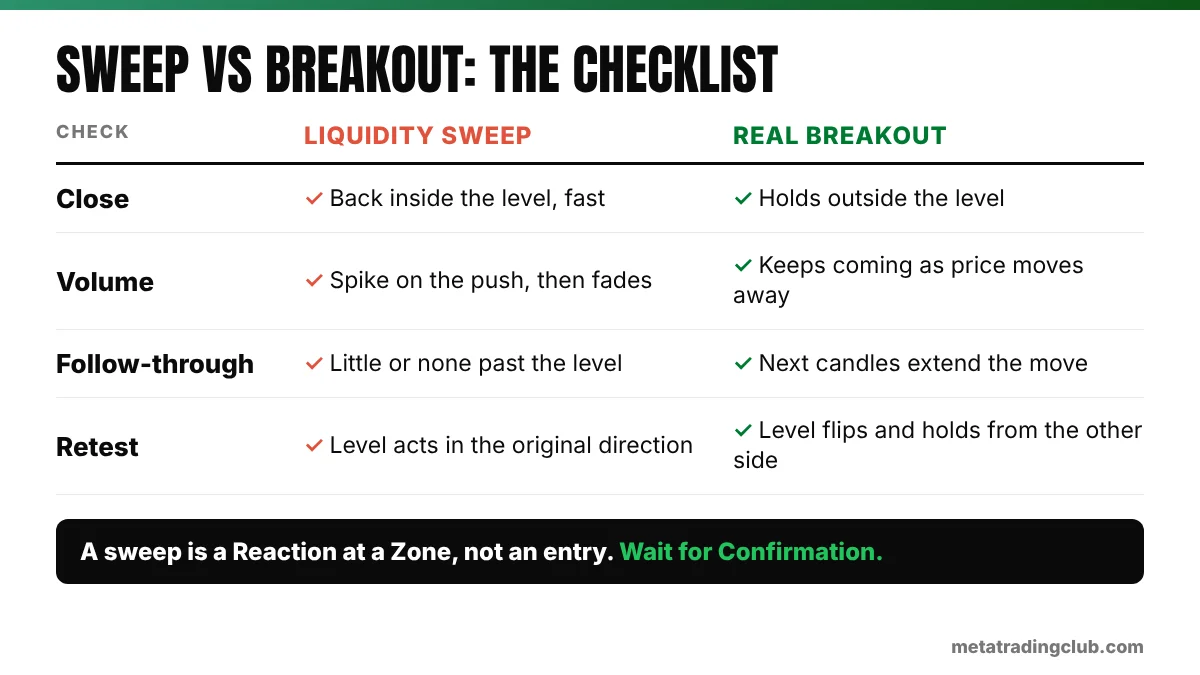
No checklist makes this certain in real time. A sweep can turn into a breakout an hour later. That is why we never act on the wick alone.
How do we read a liquidity sweep with the Alignment Engine?
At Meta Trading Club every setup goes through the same five steps of the Alignment Engine, in this order: Bias, Zone, Reaction, Confirmation, Execution. Here is where a sweep fits:
- Bias. Which way is the bigger picture leaning? A sweep of a low means more when the Bias is already up, because the reversal is with the larger trend, not against it.
- Zone. The obvious low or high is usually inside or at the edge of a Zone we already marked. No Zone, no story. A sweep in the middle of nowhere is just noise.
- Reaction. The sweep itself is the Reaction: price tested the Zone, ran the orders beyond it, and came back inside. It tells us something happened. It does not tell us to enter.
- Confirmation. We wait for price to prove the Reaction. For a sweep of a low, that usually means a close back above the level and a break of the sweep candle’s high, or a higher low that holds.
- Execution. Only after Confirmation do we plan the entry, the stop beyond the Zone and the size. If Confirmation never comes, there is no trade.
The mistake we see most is treating the wick as the entry. Buying the moment price dips below a low is a guess. Waiting for the close back inside and Confirmation turns the guess into a read.
Where should your stop go around an obvious low?
Here is the part that matters most for where your stop sits. If your stop sits a few cents under an obvious low, it sits exactly where a sweep reaches. The fix is not a random wider stop. It is a stop beyond the Zone, with a smaller position so the dollar risk stays the same. (New to stops? Start with what a stop loss is.)
MTC Analysis · Hypothetical example
Same $200 risk, two stop placements
A generic stock (no ticker) has equal lows at $50.00. We mark a Zone from $49.50 to $50.00. Both traders risk $200 per trade, so 1R = $200 in this example.
Trader A: entry before the sweep, stop just under the obvious low
- Entry $50.30, stop $49.95. Risk per share: $50.30 − $49.95 = $0.35
- Size: $200 ÷ $0.35 = 571 shares (571 × $0.35 = $199.85)
- Price sweeps to $49.70. The stop becomes a market order and, say, fills at $49.90, not $49.95.
- Loss: ($50.30 − $49.90) × 571 = $228.40, which is −1.14R. The slippage made the loss bigger than planned.
Trader B: waits for Confirmation, stop beyond the Zone
- Price closes back above $50.00, then breaks the sweep candle’s high. Entry $50.60, stop $49.40 (below the Zone and below the $49.70 sweep low).
- Risk per share: $50.60 − $49.40 = $1.20
- Size: $200 ÷ $1.20 = 166 shares (166 × $1.20 = $199.20)
- If price later reaches $52.40: $1.80 ÷ $1.20 = +1.5R ($1.80 × 166 = $298.80). If price instead closes below $49.40, the loss is about −1R.
The point: the wider stop did not mean more dollar risk. It meant fewer shares (166 instead of 571). Trader A carried more size on a tighter stop, sitting where the sweep happened. Illustration only, not a real trade or a result.
Trader B gives up some entry price and size. In return, the stop sits outside the area where orders cluster, and the entry comes after the market has shown its hand. Either version can still lose.
How we teach sweeps at Meta Trading Club
I have been trading for 8+ years, and since we founded Meta Trading Club in Toronto in November 2021 we have trained 600+ traders. Sweeps come up constantly, because they are a common reason early stops get hit.
We mark Zones in premarket prep every market day, before the open. In live trading sessions four days a week (Monday, Tuesday, Thursday and Friday), we watch those Zones and talk through it in real time when price runs an obvious high or low: is this a Reaction, and has Confirmation shown up yet?
Setups that pass all five steps get a Qualification grade (A+, A, B and so on), and the grade sets how much risk the trade is allowed. Every trade in our track record is logged in R, next to $ and %, so a sweep-driven stop-out and a winner are measured the same way.
Frequently asked questions
Sources: Investor.gov, Stop Order (glossary); Investor.gov (SEC), Investor Bulletin: Stop, Stop-Limit, and Trailing Stop Orders; FINRA, Stop Orders: Factors to Consider During Volatile Markets. Pages checked November 2026.
Featured image: AI-edited from Carol M. Highsmith’s photo of the NYSE trading floor (Library of Congress, public domain).
Education only. Not financial advice.