If you’ve spent any time studying technical analysis, you’ve encountered support and resistance. They’re among the first concepts most traders learn — and also among the most misapplied.
A lot of traders treat support and resistance as a set-and-forget system. They find a level, assume price will bounce off it, and trade that expectation. Sometimes it works. Often it doesn’t. And when it doesn’t, they blame the concept rather than the application.
The truth is, support and resistance is not a prediction tool. It’s a probability framework. It tells you where price has historically reacted, where orders are likely to cluster, and where the risk/reward on a trade shifts in your favour. Used correctly, it’s the foundation of structured trade planning. Used incorrectly, it’s a false sense of certainty in a market that doesn’t offer certainty.
This guide breaks down support and resistance from the ground up — what it actually is, how to identify levels that matter, the difference between static and dynamic levels, how zones work better than lines, and how to apply all of it to options trading in a way that’s structured and repeatable.
If you’re trading options in Canada or the US markets, understanding support and resistance at a deep level will improve everything: your entries, your exits, your risk management, and your overall read on what the market is doing.
Where price makes decisions
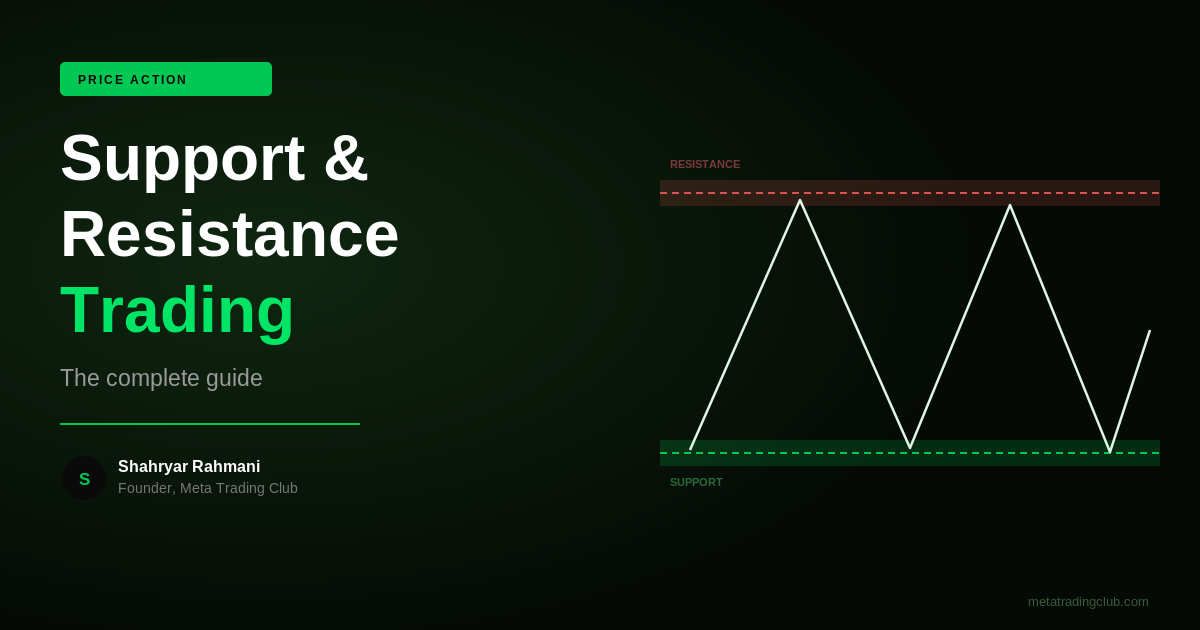
Support and resistance aren’t lines on a chart — they’re zones where buyers and sellers fight. That’s where your trades live.
What Support and Resistance Actually Are
At their core, support and resistance are price levels where buying or selling pressure has historically been strong enough to pause or reverse a move.
Support is a price level where demand has previously been sufficient to stop a decline and push price back up. Think of it as a floor — buyers have shown up at this level before, which increases the probability they’ll show up again.
Resistance is the opposite — a price level where selling pressure has previously been strong enough to halt a rally and push price back down. It acts as a ceiling, where sellers have historically been active.
The reason these levels work is not magic. It’s psychology and market mechanics.
When price reaches a level where a lot of market participants previously bought (a support zone), those same participants are watching it again. New buyers who missed the original move are watching it. Stop orders from short sellers cluster below it. All of that activity creates a natural area of price reaction.
The same logic in reverse applies to resistance.
MTC Analysis
How Price Reacts at Key Zones
Price tends to react — not stop precisely — at support and resistance. Trade the reaction and confirmation, not the line itself.
How to Identify Strong Support and Resistance
Not all levels are equal. A support level that’s been touched once is far less significant than one that’s been tested and held three or four times. Here’s what makes a level meaningful:
Multiple Touches
The more times price has tested a level and respected it — bouncing from support or rejecting from resistance — the more significant that level is. A single touch is a data point. Multiple clean touches are a pattern.
Clean, Decisive Bounces
Look for levels where price reacted sharply — not slowly drifted through. A sharp bounce from support indicates conviction from buyers at that level. A sharp rejection from resistance indicates active selling. Slow, grinding interactions with a level are less reliable signals.
High-Volume Areas
When a price level coincides with a period of heavy trading volume, that level is more significant. Volume-by-price analysis (available on most platforms) shows you exactly where the most contracts or shares traded in a given range — those areas tend to be strong support or resistance because a large number of participants have positions anchored there.
Whole Numbers and Round Levels
Psychological levels — round numbers like $50, $100, $500, or index levels like 4,500 on the S&P — tend to attract clusters of orders. They’re not technically special, but because so many market participants watch them, they become self-fulfilling reference points.
Static vs Dynamic Levels
Support and resistance doesn’t only come in horizontal form. Understanding the difference between static and dynamic levels gives you a more complete picture of the market.
Static Support and Resistance
Static levels are horizontal price levels — they don’t move over time. These are the classic S/R levels: a prior high from six months ago, a key low that held multiple times, a major psychological round number. They’re permanent reference points on your chart.
Identifying static levels involves looking at clean price history on a higher timeframe (daily, weekly) and noting where price has clearly reacted before. Prior swing highs and lows are your starting point.
Dynamic Support and Resistance
Dynamic levels move with price over time. The most common examples:
- Trend lines — drawn connecting a series of swing highs (resistance trend line) or swing lows (support trend line)
- Moving averages — the 20 EMA, 50 SMA, and 200 SMA are widely followed by institutional traders, making them active dynamic S/R
- VWAP (Volume Weighted Average Price) — especially important for intraday trading; price tends to gravitate back toward VWAP throughout the session
Dynamic levels are particularly useful in trending markets. In a strong uptrend, the 20 EMA often acts as a recurring support level — price pulls back to it and bounces. That’s a consistent, repeatable pattern that can be traded.
Why Zones Work Better Than Lines
One of the most important mindset shifts in S/R trading is moving from thinking about lines to thinking about zones.
Price doesn’t operate with surgical precision. It doesn’t turn on a dime at exactly $47.82 and never trade a tick below it. Markets are messy. Stops get run. Price briefly pierces a level before reversing. If you draw a thin line and expect price to respect it exactly, you’ll get frustrated constantly.
Zones solve this.
Instead of drawing a line at $47.82, you draw a zone from $47.50 to $48.10 — the range within which price has historically reacted. This gives you a more realistic picture of where buying or selling pressure tends to emerge, rather than an overly precise level that gets violated on any minor news or slippage.
Drawing zones also forces you to be honest about the level’s significance. If you can’t define a reasonable zone around a level, it probably isn’t a strong enough level to trade.
Role Reversal: When Support Becomes Resistance
One of the most reliable patterns in all of technical analysis is role reversal — when a broken support level becomes new resistance, and vice versa.
Here’s the logic: imagine a stock that traded above $50 for months, with $50 acting as support. A lot of buyers accumulated positions at or near that level. When price finally breaks below $50, those buyers are now underwater. They’re watching and waiting for price to get back to their entry so they can exit at breakeven. That trapped-buyer activity turns the old support ($50) into new resistance — price rallies back to $50, those sellers unload, and resistance holds.
Understanding role reversal helps you:
- Identify higher-probability resistance levels after a break
- Avoid buying into a broken support level expecting it to hold
- Plan re-entry after a breakout pullback
This concept is one of the most practical applications of S/R in real trading, and it shows up consistently across all timeframes and markets.
Comparison: Weak vs Strong Support/Resistance Levels
| Characteristic | Weak Level | Strong Level |
|---|---|---|
| Number of Touches | 1–2 | 3+ |
| Reaction Quality | Slow drift, unclear reversal | Sharp, decisive bounce or rejection |
| Volume at Level | Below average | High volume cluster |
| Timeframe Alignment | Visible only on lower timeframes | Visible on daily, weekly charts |
| Round Number / Psychological | No | Often yes |
| Role Reversal History | No | Has flipped from support to resistance or vice versa |
| Confidence for Options Trading | Low — avoid using as anchor | High — suitable for entry planning |
How to Apply Support and Resistance to Options Trading
Support and resistance directly informs where you enter, where you place stops (or define risk), and where you take profit on options trades.
Where to Enter
The highest-probability entries are near strong support (for calls/bullish trades) or near strong resistance (for puts/bearish trades). You’re entering where price has historically reacted, giving you a clear nearby invalidation point if price moves through the level.
Where to Define Risk
The level itself serves as your invalidation point. If you’re buying calls at support, the trade is invalidated if price breaks clearly below that support zone. Your risk is defined as the move from your entry to that invalidation. On options, this translates to a stop on the option price or a maximum loss per position.
Where to Take Profit
Profit targets logically sit near the next significant level in your direction. If you’re long from support, the next resistance zone is your initial target. If price clears that resistance, you reassess whether to stay in or exit.
Spread Strategy Application
For options spread traders, S/R levels are especially valuable for positioning. Selling spreads with the short strike just outside a strong resistance level (on a call spread) puts the highest-probability S/R in your favour. The same logic applies to put spreads below strong support.
How MTC Uses Key Levels in the Alignment Engine
At Meta Trading Club, key levels — which are essentially our highest-conviction support and resistance zones — are the second step of the MTC Alignment Engine.
The process is: Market Bias → Key Level → Reaction → Confirmation → Execution.
After establishing what the overall market bias is (bullish, bearish, neutral), we identify the specific key levels that matter for that session. We then watch how price reacts at those levels. Only when we see a defined reaction at a meaningful level do we look for confirmation on a lower timeframe before executing.
The key level step filters out trades that aren’t at meaningful locations. It keeps us from trading in the middle of nowhere — which is one of the most common ways people take unnecessary risk.
If you want to understand market structure more deeply as a foundation for this kind of analysis, this post on market structure trading is a natural next step. And when it comes to applying these levels in real time at the session open, our guide on trading the market open covers exactly how we do that each morning.
Build a Structured Approach to Key Levels
Identifying support and resistance is a skill. Knowing what to do at those levels is the next step — and that’s where a structured process makes all the difference.
At Meta Trading Club, every trade starts at a key level. Our daily premarket sessions walk through exactly where the levels are, what we’re watching for, and how we’re framing the trade plan before the open. It’s live, it’s structured, and it’s applied to real market conditions every day.
Join the MTC Community — 7-day free trial, $99/month
Stop drawing lines and hoping. Start building a process that uses levels the right way.
Proprietary Framework
The MTC Alignment Engine™ — Applied Every Live Session
Every trade runs the same five checkpoints — consistency over gut reaction. Inside the MTC Incubator, members build their own system on top of this framework.
Frequently Asked Questions
What is support and resistance in trading?
Support is a price level where buying pressure has historically been strong enough to stop a decline and cause price to reverse upward. Resistance is the opposite — a price level where selling pressure has stopped rallies and pushed price back down. These levels form because market participants have collective memory of where price reacted in the past, and order clusters at those levels tend to cause repeated reactions. Support and resistance are the foundation of most price action analysis and trade planning.
How do you find support and resistance levels?
Start with a higher timeframe chart — daily or weekly — and look for clear price levels where the market has reversed multiple times. Swing highs and swing lows are your starting points. Mark levels where price tested and held at least two or three times with clean, decisive reactions. Then bring those levels down to your trading timeframe (15-min, 1-hour) for execution context. Volume profile tools can also help you identify high-volume price clusters, which tend to be strong S/R areas.
What is the difference between static and dynamic support and resistance?
Static support and resistance levels are horizontal price levels that don’t change over time — they’re fixed on your chart regardless of when you look at them. Dynamic levels move with price: trend lines connect swing highs or lows and slope accordingly, while moving averages (like the 50 SMA or 200 SMA) recalculate with each new candle. Both types are valid, but they’re most powerful when they align — a static horizontal level coinciding with a rising 200 SMA creates a particularly strong zone.
Why do support levels become resistance after a break?
This is called role reversal. When a support level breaks, buyers who were holding positions at that level are now at a loss. They watch price closely and often sell as soon as price returns to their entry point (breakeven), creating new selling pressure at the old support level. Meanwhile, short sellers who entered on the break are also managing their positions around that level. The result is that old support becomes new resistance — a pattern that shows up consistently across all markets and timeframes.
How do you use support and resistance for options trading?
Support and resistance inform three key decisions in options trading: entry location (enter near strong S/R for best risk/reward), risk definition (use the S/R level as your invalidation point — if price breaks through, the trade is wrong), and profit targets (set initial targets at the next significant S/R level in your direction). For spread traders, selling the short strike of a credit spread just beyond a strong S/R level puts the probability structure in your favour by using the market’s own price behaviour as confirmation.
Are support and resistance levels always reliable?
No. Support and resistance are probability-based tools, not guarantees. Levels break. Markets trend through them. News events override technical structure. The goal isn’t to find levels that will never break — it’s to identify areas where the probability of a reaction is higher than average, giving you a structured basis for entries and exits. Strong levels (multiple touches, high volume, visible on higher timeframes) are more reliable than weak ones. Using zones rather than exact lines, and always defining your risk if the level fails, is how you trade S/R without assuming certainty.
Meta Trading Club Community
Start Your 7-Day Free Trial
Daily live sessions. Real-time market prep — not signals. The MTC Alignment Engine™ applied in front of you. Trade alongside Shahryar from day one.
Cancel anytime. No contracts. Built for Canadian traders.
Already trading and want to build your own system?
The MTC Incubator is an application-based mentorship — 1-on-1 work building a personalized system on the Alignment Engine™.
Related reading
- Market Structure Explained: How to Read Price Action Like a Pro
- How to Build a Weekly Trading Watchlist (Quality Over Quantity)
Want to learn this live? Trade alongside us inside the MTC community — start your 7-day free trial.
Some links below are affiliate links — if you sign up through them, MTC may earn a commission at no extra cost to you. We only recommend tools we’d use ourselves.
Want to chart these setups yourself? We use TradingView for fast, clean charts.