A fair value gap is a three-candle pattern where the wicks of the first and third candles don’t overlap. The empty space between them is a price range the middle candle moved through fast, with little two-way trade. Traders call it an imbalance. The term comes from ICT and “smart money” teaching.
It’s one of the most searched chart ideas right now, and one of the most misused. Below we’ll mark one properly, compare it with similar ideas, and show where it fits in a real process.
Key takeaways
- An FVG is measured wick to wick: candle 1’s high to candle 3’s low (bullish), or candle 1’s low to candle 3’s high (bearish).
- “Fair value gap” is trader slang, not an official exchange term. Price did trade through the range; it just traded mostly one way.
- Price often comes back into part of the gap, but not always, and a revisit is not a reason to trade.
- On its own an FVG is a place to watch. It only matters to us when it overlaps a Zone and agrees with the higher-timeframe Bias.
- Reaction and Confirmation are still required, and Qualification decides the risk.
What is a fair value gap, in plain words?
When three candles sit normally, their ranges overlap. Buyers and sellers are both active at those prices.
Sometimes the middle candle is so strong that candle 3 never reaches back to candle 1. That leaves a strip of price, inside the big middle candle, that only candle 2 ever touched. Traders who use the term say the market “skipped” fair two-way pricing there, so it’s an imbalance between buying and selling pressure.
No indicator or special data needed. You can see it on any candlestick chart, on any timeframe.
A note on the name: you won’t find “fair value gap” in exchange or regulator glossaries. CME Group’s glossary defines a gap as “a price area at which the market didn’t trade from one day to the next” and lists “fair value” only for futures and options pricing (CME Group glossary). FVG is trader terminology, popularised by ICT-style teaching. Useful as a label, but it carries no official meaning.
How do you mark a fair value gap on a chart?
Use wicks, not candle bodies. That’s the rule most people get wrong.
- Bullish FVG: three candles, middle one a strong up candle. If candle 3’s low is above candle 1’s high, the gap runs from candle 1’s high (bottom) to candle 3’s low (top).
- Bearish FVG: middle one a strong down candle. If candle 3’s high is below candle 1’s low, the gap runs from candle 3’s high (bottom) to candle 1’s low (top).
- No gap: if the wicks of candle 1 and candle 3 touch or overlap at all, there is no FVG. Don’t stretch the rule.
Many traders also mark the midpoint of the range (some call it “consequent encroachment”). It’s simply the average of the top and bottom. We’ll do the maths in the worked example below.
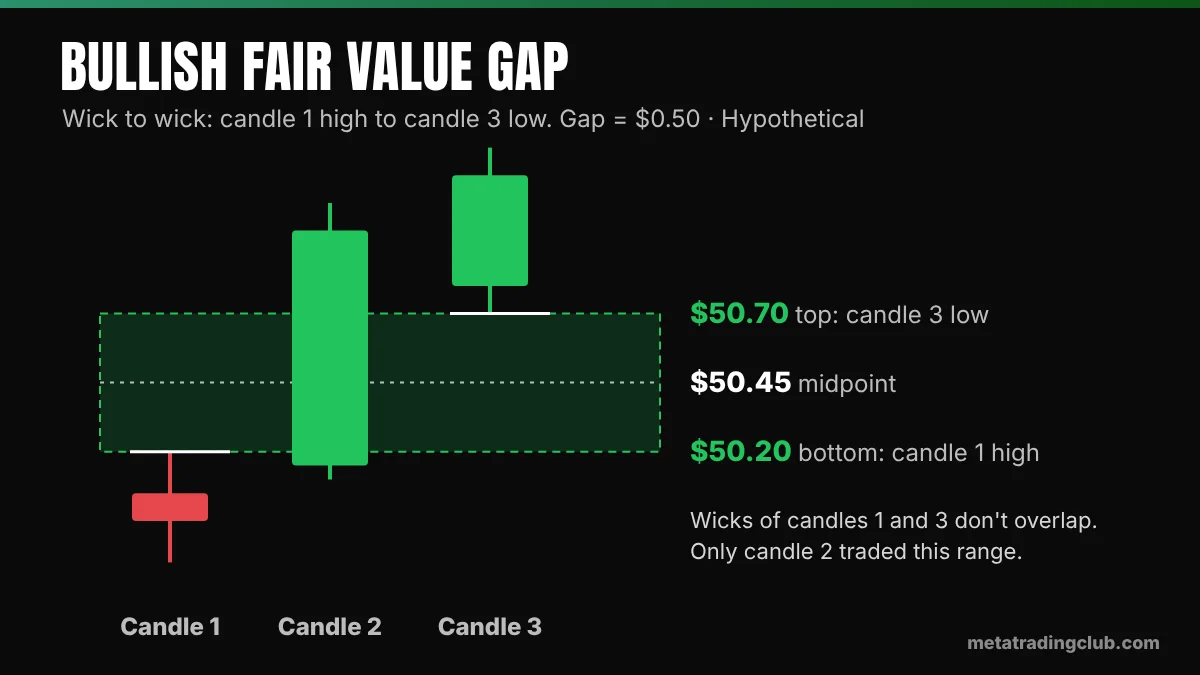
Extend the box to the right. If price later closes beyond its far side, the gap is filled and you can delete it.
Why does an imbalance form in the first place?
Prices move because orders meet. A limit order is “an order to buy or sell a security at a specific price or better,” and a market order is “an order to buy or sell a security immediately” (Investor.gov). When aggressive market orders on one side eat through the resting limit orders on the other, price moves quickly through a range with little back-and-forth.
Exchanges use the word differently. The NYSE publishes imbalance data during its opening and closing auctions: the number of shares that are “not already matched at the Reference Price” (NYSE Auctions). That’s a real order count; a chart FVG is only a visual guess that one side was in control. If you want to see actual buying and selling pressure, that’s the job of order flow tools like the tape and Level 2.
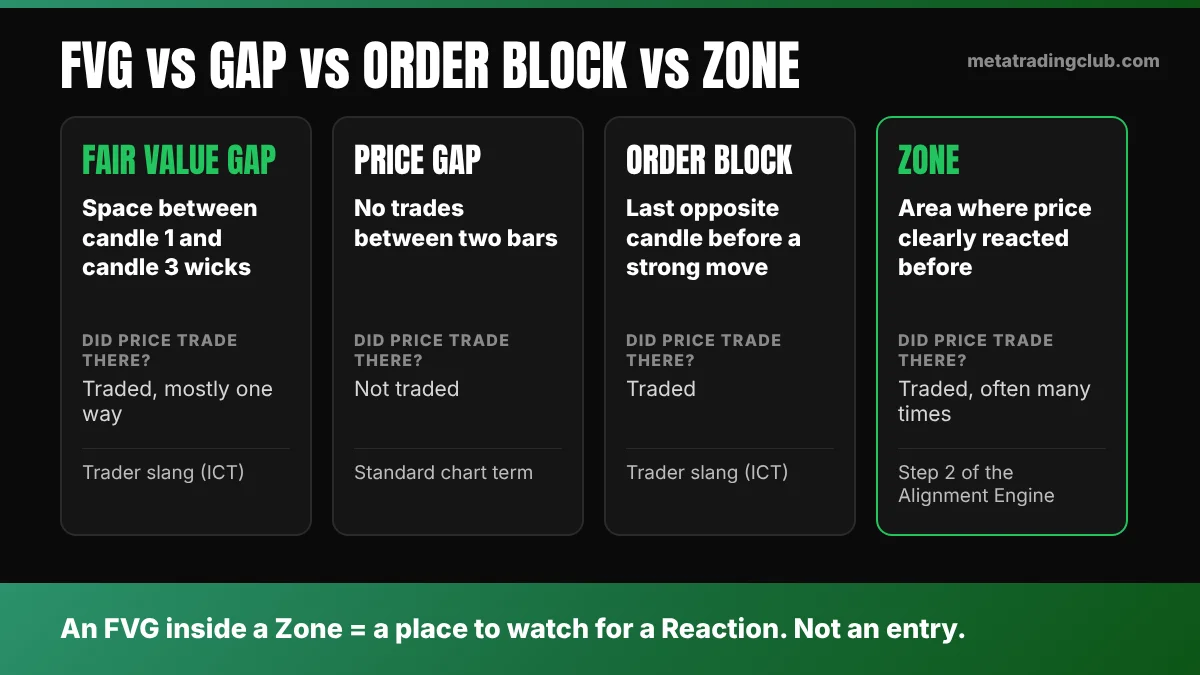
FVG vs price gap vs order block vs Zone: what’s the difference?
| Fair value gap | Classic price gap | Order block | Zone (MTC) | |
|---|---|---|---|---|
| What it is | Space between candle 1 and candle 3 wicks | Price area with no trades at all between two bars | Last opposite-colour candle before a strong move | Price area where the market has clearly reacted before |
| Did price trade there? | Yes, but mostly one way (candle 2 only) | No | Yes | Yes, often many times |
| Where it shows up | Any timeframe, in the middle of moves | Mostly at the open, after news or overnight | Right before a displacement move | Prior highs/lows, ranges, higher-timeframe levels |
| Official term? | No, trader slang (ICT) | Yes, standard chart term | No, trader slang (ICT) | Our name for support/resistance areas |
| How we treat it | Extra detail inside a Zone | Context for the day’s open | Can help mark a Zone’s edge | Step 2 of the Alignment Engine |
The classic gap is the one to compare most carefully. On a daily chart, a gap means no trades happened between yesterday’s range and today’s. That’s what strategies like the gap and go are built around. An FVG, by contrast, sits inside a candle that did trade there. Same word, different thing.
And a Zone is the bigger picture. It’s the area on the chart where price has already shown it cares, the idea behind classic support and resistance trading. An FVG is a small detail; a Zone is the map.
What usually happens when price returns to an FVG?
Price often comes back into at least part of the gap. That’s the “fill” or “rebalance” traders talk about. Then one of three things tends to happen:
- It reacts and holds. Price dips into the gap, finds buyers (bullish case), and moves away.
- It fills completely and keeps going. Price runs straight through the gap and closes beyond it. The imbalance is gone and the idea is invalid.
- It never comes back. In a strong trend, many gaps stay open for a long time.
Nobody can tell you in advance which one you’ll get, and any “FVGs work X% of the time” claim deserves real suspicion. The return to an FVG behaves a lot like a retest in trading: the level is just where you look. What price does there is what counts.
What are the biggest mistakes traders make with fair value gaps?
- Treating every FVG as an entry. Open any 5-minute chart and you’ll find dozens. If each one is a trade, you’re overtrading by design.
- Ignoring the higher-timeframe Bias. A bullish FVG on a 5-minute chart, sitting under daily resistance in a downtrend, is a small bump in a bigger fall. Direction comes first.
- Trading tiny gaps on 1-minute noise. A gap a few cents wide on a 1-minute chart is often just a quick print, not an imbalance worth respecting.
- Stacking jargon instead of reasons. FVG plus order block plus “liquidity” can sound like confluence while all three describe the same candle. Real confluence in trading means independent reasons pointing the same way. (Liquidity sweeps, where price runs past an obvious high or low and snaps back, are a separate topic for another day.)
How do we use an FVG inside the Alignment Engine?
We at Meta Trading Club run every idea through the same five steps, in the same order: Bias → Zone → Reaction → Confirmation → Execution. An FVG doesn’t get its own step. It’s a detail that can sharpen step 2.
- Bias. What is the higher timeframe doing? We only care about bullish gaps when the bigger picture leans up, and bearish ones when it leans down.
- Zone. Is there a real Zone here: a prior high, prior low, or range edge price has respected before? An FVG that overlaps a Zone is a place to watch for a Reaction. An FVG in the middle of nowhere is not.
- Reaction. When price arrives, does it slow down, reject, leave wicks? No reaction, no idea.
- Confirmation. We still need our confirmation on the execution timeframe, such as a break of the small structure that formed inside the Zone. The FVG itself is never the confirmation.
- Execution. Only now do we define entry, stop and target, sized in R.
A setup that passes all five then gets a Qualification grade: A+, A or B. The grade decides how much risk the trade is allowed. An FVG overlapping a strong Zone might help a setup earn a higher grade; it never replaces a missing step. The full framework is laid out in the MTC Alignment Engine.
MTC Analysis · Hypothetical example
Marking a bullish FVG and planning it in R
Three 5-minute candles on an imaginary stock. The higher-timeframe Bias is up, and the area around $50 is a Zone where price bounced earlier in the week.
- Candle 1: high $50.20, low $49.80
- Candle 2: high $51.10, low $50.10 (strong up candle)
- Candle 3: high $51.30, low $50.70
1. Is there a gap? Candle 3’s low ($50.70) is above candle 1’s high ($50.20). Yes, a bullish FVG.
2. Gap range: $50.20 to $50.70. Size = 50.70 − 50.20 = $0.50.
3. Midpoint: (50.20 + 50.70) ÷ 2 = $50.45.
4. The plan, only if Reaction and Confirmation show up: say price pulls back into the gap, rejects near the midpoint, and confirms. Entry $50.50. Stop $50.10, below the gap’s bottom with a small buffer. Risk = 50.50 − 50.10 = $0.40 = 1R.
5. Target: the high of candle 3 at $51.30. Reward = 51.30 − 50.50 = $0.80 = 0.80 ÷ 0.40 = 2R.
6. Invalidation: a close below $50.20 means price traded through the whole gap. The idea is off, no matter how good it looked.
Illustrative numbers only, not a real ticker or a trade idea. To turn 1R into a share count, try our position size calculator.
Is a fair value gap an edge on its own?
An FVG describes what already happened: price moved fast. It doesn’t tell you who is still in the market, whether the higher timeframe agrees, or where you’re wrong.
So we treat it as a location, not a decision.
How do we teach this at Meta Trading Club?
I’ve been trading for 8+ years, and since we founded Meta Trading Club in Toronto in November 2021 we’ve trained 600+ traders. New traders often learn a label like FVG, then see it everywhere.
So we teach it the other way round. Every market day we do premarket prep, marking higher-timeframe Bias and Zones before the open. In our live trading sessions, four days a week (Monday, Tuesday, Thursday and Friday), we work from those Zones and walk through Reaction and Confirmation in real time. A label like FVG is only ever a detail inside that process. Our track record is logged in R, so every idea is judged by the same yardstick.
Frequently asked questions
Sources: CME Group, Glossary (definition of a gap; “fair value gap” is not listed); Investor.gov, Types of Orders (market and limit order definitions); NYSE, Auctions (exchange use of “imbalance”). All checked November 2026.
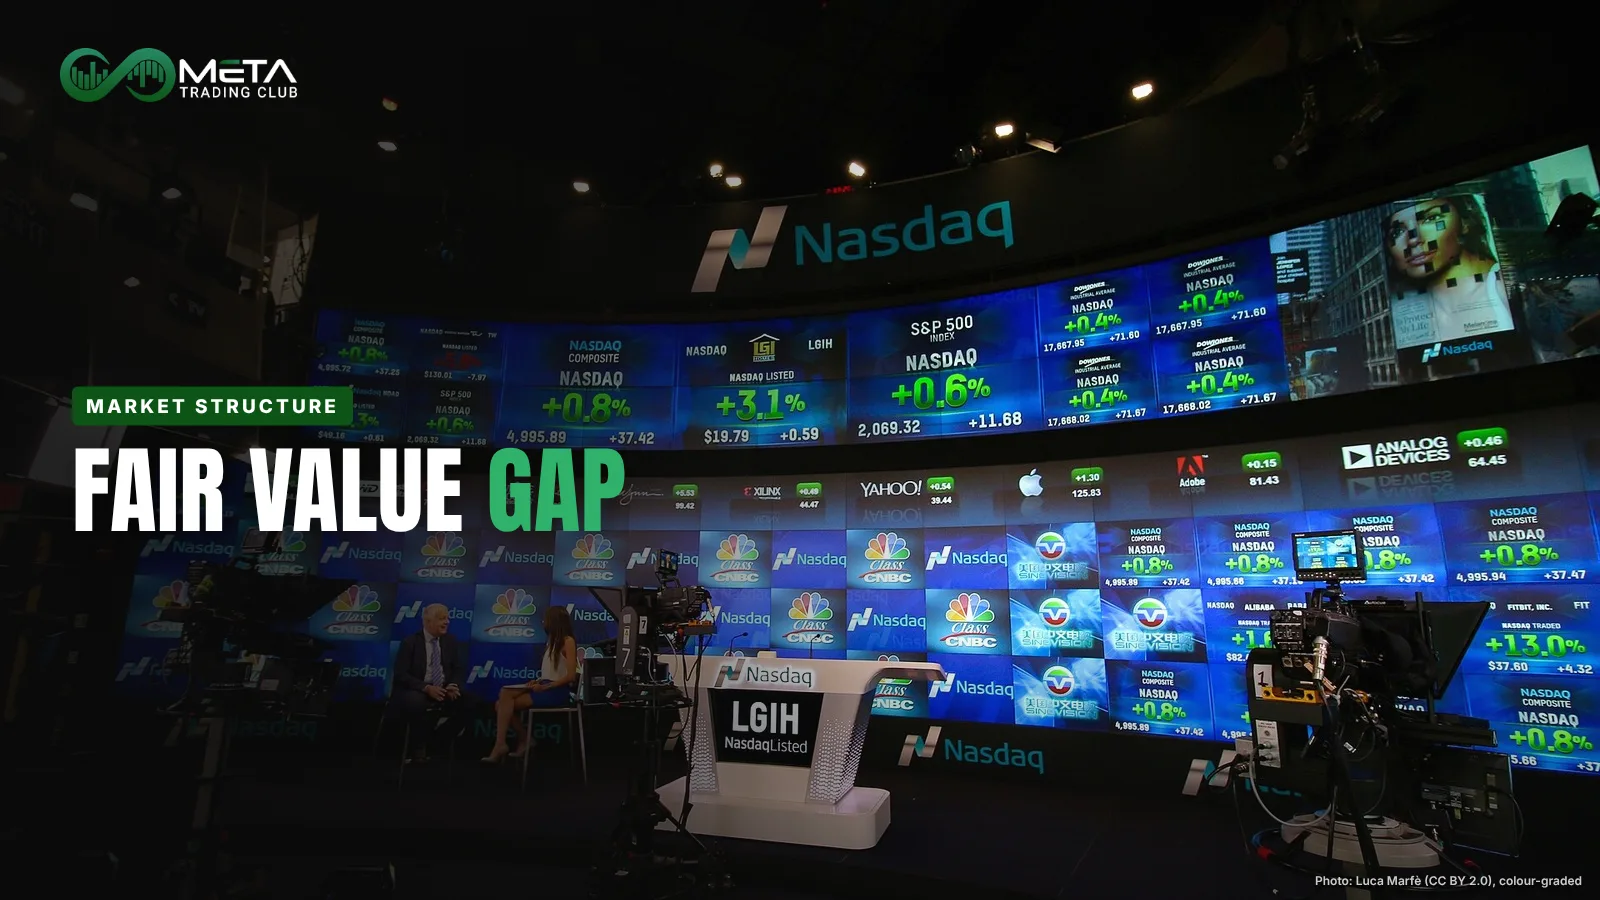
Featured image: “NASDAQ Market Site” by Luca Marfè (CC BY 2.0, Wikimedia Commons), colour-graded.
Education only. Not financial advice.