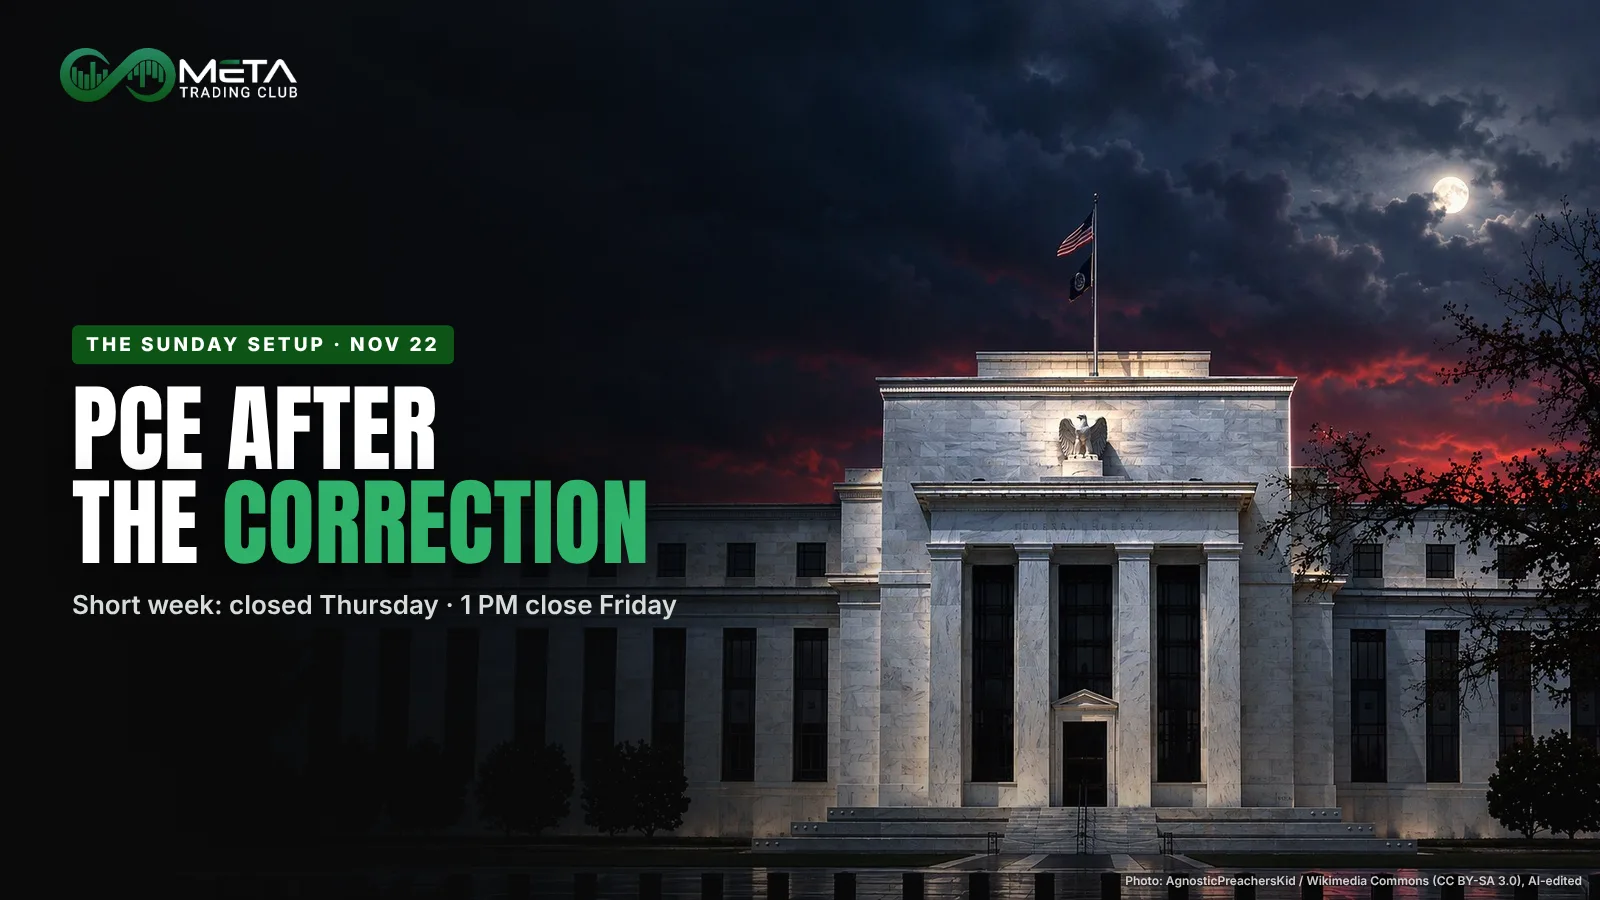
Thanksgiving week starts right after a correction: the S&P 500 fell 8.6% last week and closed more than 10% below its October record. The short week brings Dell Tuesday night, PCE inflation Wednesday at 8:30 AM ET, a market holiday Thursday and a 1:00 PM close Friday.
This is the blog edition of The Sunday Setup, my weekly email for traders. Here’s what happened last week, what matters this week, and how I’m planning around it.
Last Week: The S&P 500 Fell Into a Correction
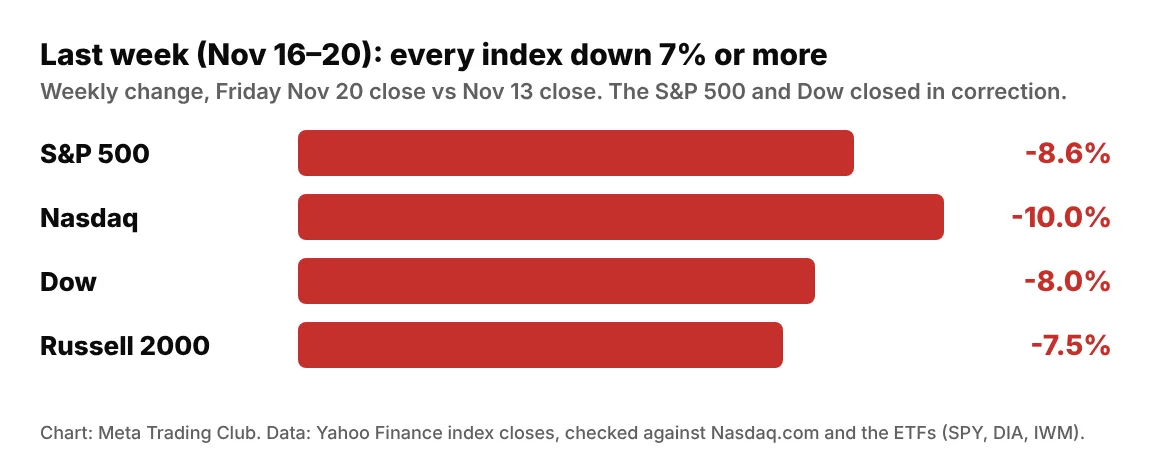
The S&P 500 fell 8.61% to 6,910.39, its worst week in more than 18 months (AP), and closed in correction, more than 10% below its October 6 record. The Nasdaq fell 10.02% to 22,617.73 and is now down for 2026. The Dow lost 8.02% to 48,147.33, also in correction, and the Russell 2000 7.48% to 2,581.79. The S&P 500 fell all five days.
Chip and AI stocks led it down. Chips sold off on Monday (our Nov 16 close recap). Nvidia beat on Tuesday: $115.8 billion in revenue against about $109.1 billion expected, and a $130 billion guide for next quarter (Nvidia 8-K; LSEG, FactSet). The stock opened about 2.5% higher Wednesday and closed about 2.9% lower (Nov 17 and Nov 18 close recaps). Anthropic priced its IPO at $83 on Wednesday night, opened Thursday at $111.50 and closed at $97.17, and the market reversed lower the same day (Nov 19 close recap).
Friday was the worst day: S&P 500 -3.7%, Nasdaq -5.3%, Nvidia down about 13% (Nov 20 close recap). Reuters reported that SEC enforcement staff are examining potential accounting issues at Nvidia; the SEC declined to comment, and an inquiry is not a finding of wrongdoing. A day earlier, California’s attorney general subpoenaed the company.
Rates: Yields Fell, a Fed Hike Is Still Priced
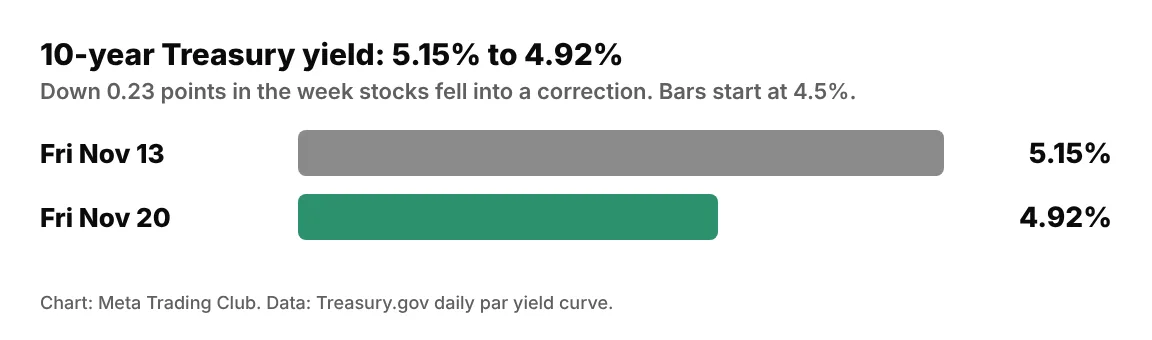
The 10-year Treasury yield fell from 5.15% to 4.92% for the week (Treasury.gov). The Fed’s rate is 3.75%-4.00%, and its next decision is December 9. As of Friday, futures priced about a 92%-97% chance of a December hike (CME FedWatch via Yahoo Finance, Fri Nov 20).
That’s why Wednesday matters. October PCE, the Fed’s preferred inflation gauge, comes out at 8:30 AM ET (BEA). Forecasts call for core PCE of +0.3% on the month and 3.2% from a year ago, after 3.1% (forecasts via Trading Economics, NordFX and bkobog; prior via FinancialJuice). Headline PCE is expected at +0.3% on the month after +0.5%.
What I watch: the core number, then the 10-year in the first 15 minutes. A hot print into a holiday, with a hike already priced, can move rates and stocks the same morning.
The Thanksgiving Week, Day by Day (Times ET)
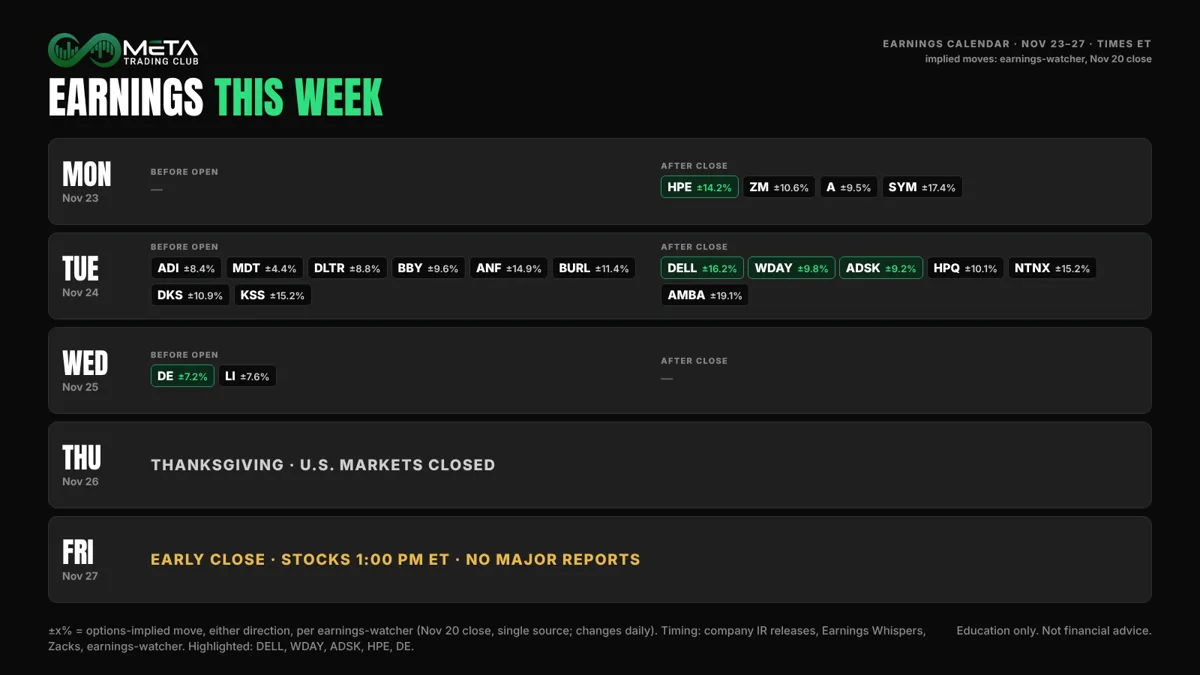
- Mon Nov 23: S&P Global flash PMIs (morning). 2-year note auction. Hewlett Packard Enterprise, Zoom and Agilent after the close.
- Tue Nov 24: Conference Board consumer confidence at 10:00, after 91.7 in October. Bank of Canada Governor Macklem speaks to the Economic Club of Canada at about 12:40 PM (BoC). Analog Devices, Medtronic, Best Buy, Dollar Tree, Abercrombie & Fitch, Burlington, Dick’s and Kohl’s before the open; Dell, Workday, Autodesk, HP Inc and Nutanix after the close. 5-year note auction.
- Wed Nov 25: 8:30: October PCE and personal income, the second estimate of Q3 GDP (first estimate 3.4%), durable goods, and jobless claims a day early for the holiday. New home sales at 10:00. Fed Beige Book at 2:00 PM. Deere before the open. 7-year note auction.
- Thu Nov 26: Thanksgiving. U.S. stock and bond markets closed. Statistics Canada releases payroll data at 8:30.
- Fri Nov 27: Early close: stocks at 1:00 PM (NYSE), bonds at 2:00 PM (SIFMA recommendation). Advance trade and inventories at 8:30. Canada’s Q3 current account at 8:30.
Release times: BEA, Census Bureau, Federal Reserve Board, NYSE, SIFMA, Statistics Canada, Bank of Canada. Consensus where shown has at least two sources; we left out the GDP and durable goods forecasts because sources disagreed. Canada’s Q3 GDP comes Monday, November 30, and the Bank of Canada (2.50%) decides on December 9.
Earnings Watch: Dell and the Software Names
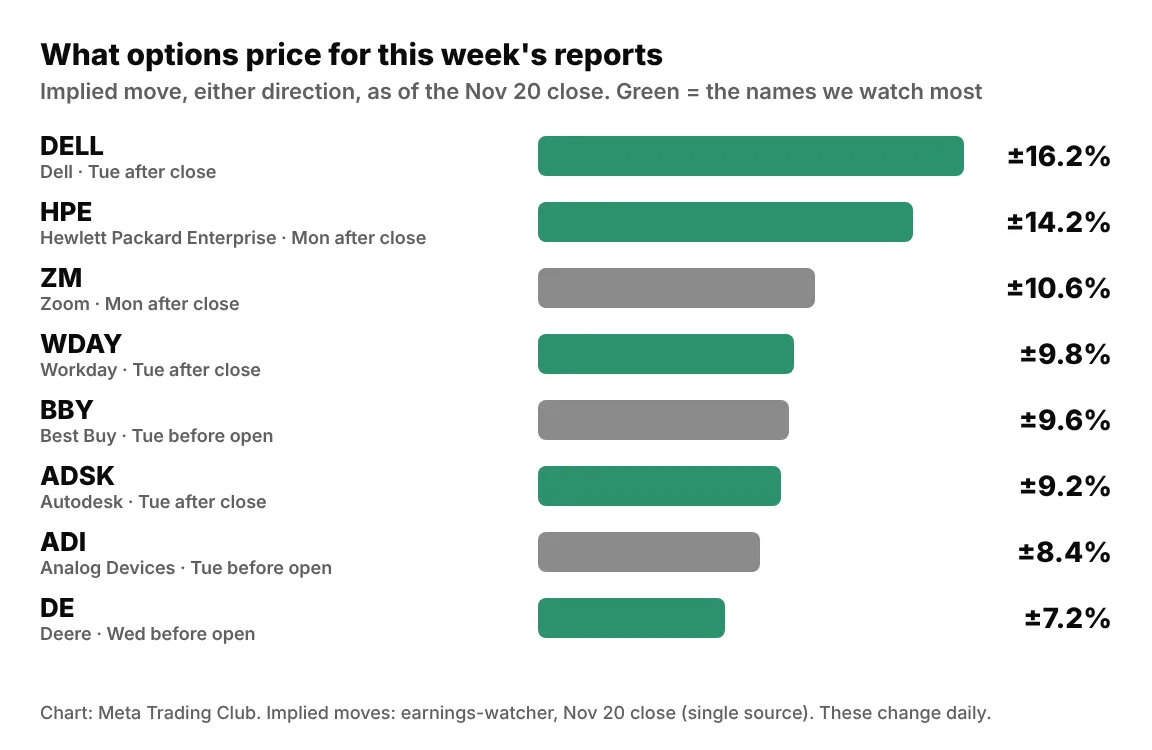
The implied move is the options market’s guess at the size of the reaction, in either direction. Per earnings-watcher (Nov 20 close, single source): Dell about ±16.2%, Hewlett Packard Enterprise ±14.2%, Zoom ±10.6%, Workday ±9.8%, Best Buy ±9.6%, Autodesk ±9.2%, Analog Devices ±8.4% and Deere ±7.2%.
Dell is the AI-server test after last week’s chip selloff: analysts expect $6.63 a share (Earnings Whispers, Zacks). Workday ($2.74 a share expected) and Autodesk ($3.07) report the same night, after a week when software stocks sold off hard. Deere ($4.07 expected) is the last notable report, Wednesday morning.
One Lesson: Drops Are Normal. Your Size Decides the Damage.
Since 1980, the S&P 500’s biggest drop inside a calendar year has averaged about 14% (J.P. Morgan Guide to the Markets; Fidelity). J.P. Morgan counts 35 of those 46 years that still ended higher. Past results don’t guarantee future results, but a 10% correction is not a strange event. It’s part of the deal.
What turns a normal drop into real damage is position size. Friday, my first Nvidia short got stopped out on a fakeout (-1.2R). I didn’t jump straight back in. I waited for the setup to come back, re-entered, and closed that one at +4.8R. Both trades were sized for being wrong.
That’s why we run the Alignment Engine the same way in every market: Bias, Zone, Reaction, Confirmation, Execution. Then the grade sets the risk. In a week like last week, fewer setups pass, and the ones that do get smaller size.
How I’m Handling It
- Monday: zones marked Sunday night. Places to watch for a reaction, not orders.
- Tuesday night: no position into Dell or the software reports that I’d mind seeing gap against me.
- Wednesday 8:30: flat into PCE. Read core, watch the 10-year, then wait for price to reach a zone and react.
- Thursday and Friday: market closed Thursday. Friday is a short, thin session; if I trade, it’s the morning only, and small.
- All week: smaller size while the fear gauge is high and moves are this big.
A correction tests your size, not your predictions. No alignment, no trade.
FAQ
No. U.S. stock and bond markets are closed on Thursday, November 26, 2026. On Friday, November 27, the NYSE closes early at 1:00 PM ET, and SIFMA recommends a 2:00 PM ET close for the bond market.
Wednesday, November 25, 2026 at 8:30 AM ET (Bureau of Economic Analysis). Forecasts call for core PCE of +0.3% on the month and 3.2% from a year ago, after 3.1%.
Tuesday, November 24, 2026, after the close, with the call at 4:30 PM ET (earnings-watcher; Börse-Express). Options price a move of about 16% either way, per earnings-watcher as of the Nov 20 close (single source).
Sources: AP, CNBC, NBC, Yahoo Finance, Nasdaq.com, Treasury.gov, Nvidia 8-K, Reuters (via 24/7 Wall St and Yahoo), California Attorney General, CME FedWatch (via Yahoo Finance), Bureau of Economic Analysis, Census Bureau, Federal Reserve Board, NYSE, SIFMA, Statistics Canada, Bank of Canada, FinancialJuice, Trading Economics, NordFX, Earnings Whispers, Zacks, earnings-watcher, company investor relations, J.P. Morgan Asset Management (Guide to the Markets, 4Q 2026), Fidelity. Single-source figures are named in the text. Featured image: AI-edited from “Marriner S. Eccles Federal Reserve Board Building” by AgnosticPreachersKid, Wikimedia Commons, CC BY-SA 3.0. Charts: Meta Trading Club.
Written by Shahryar Rahmani. Education only. Not financial advice.