

Tuesday, November 17, 2026 · 10:25 AM ET · Shahryar Rahmani, MTC Desk
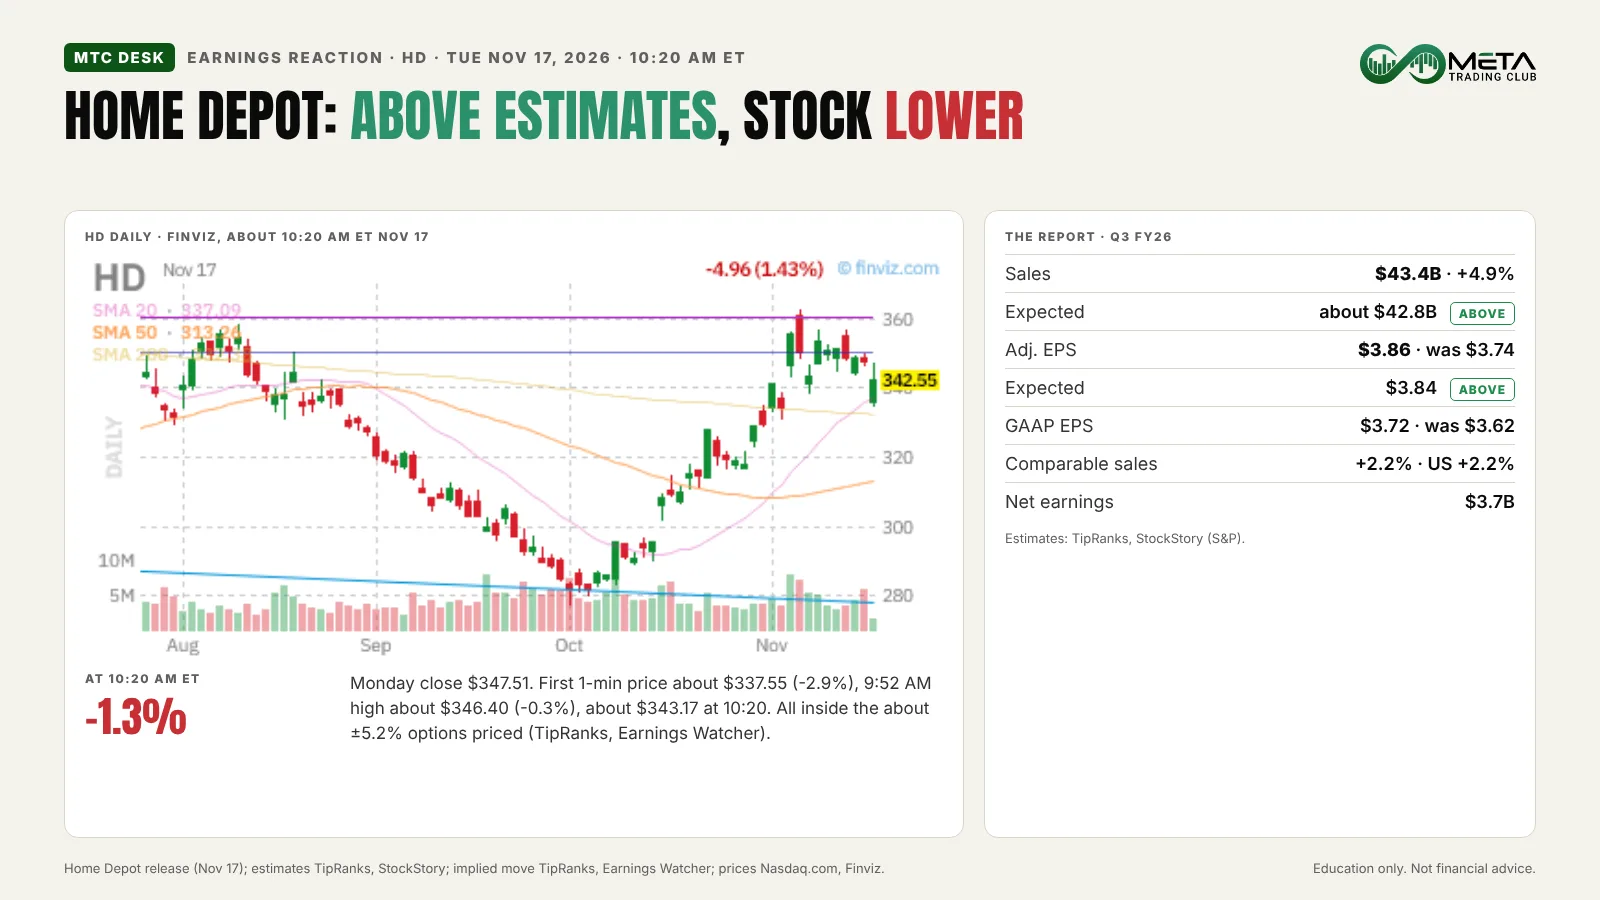
Home Depot earnings reaction: Home Depot reported sales of $43.4 billion and adjusted EPS of $3.86, above the about $42.8 billion and $3.84 expected (EPS narrowly), but the stock opened about 2.9% lower and was about 1.3% lower at 10:20 AM ET, inside the about 5.2% implied move.
The Home Depot earnings reaction vs what options priced
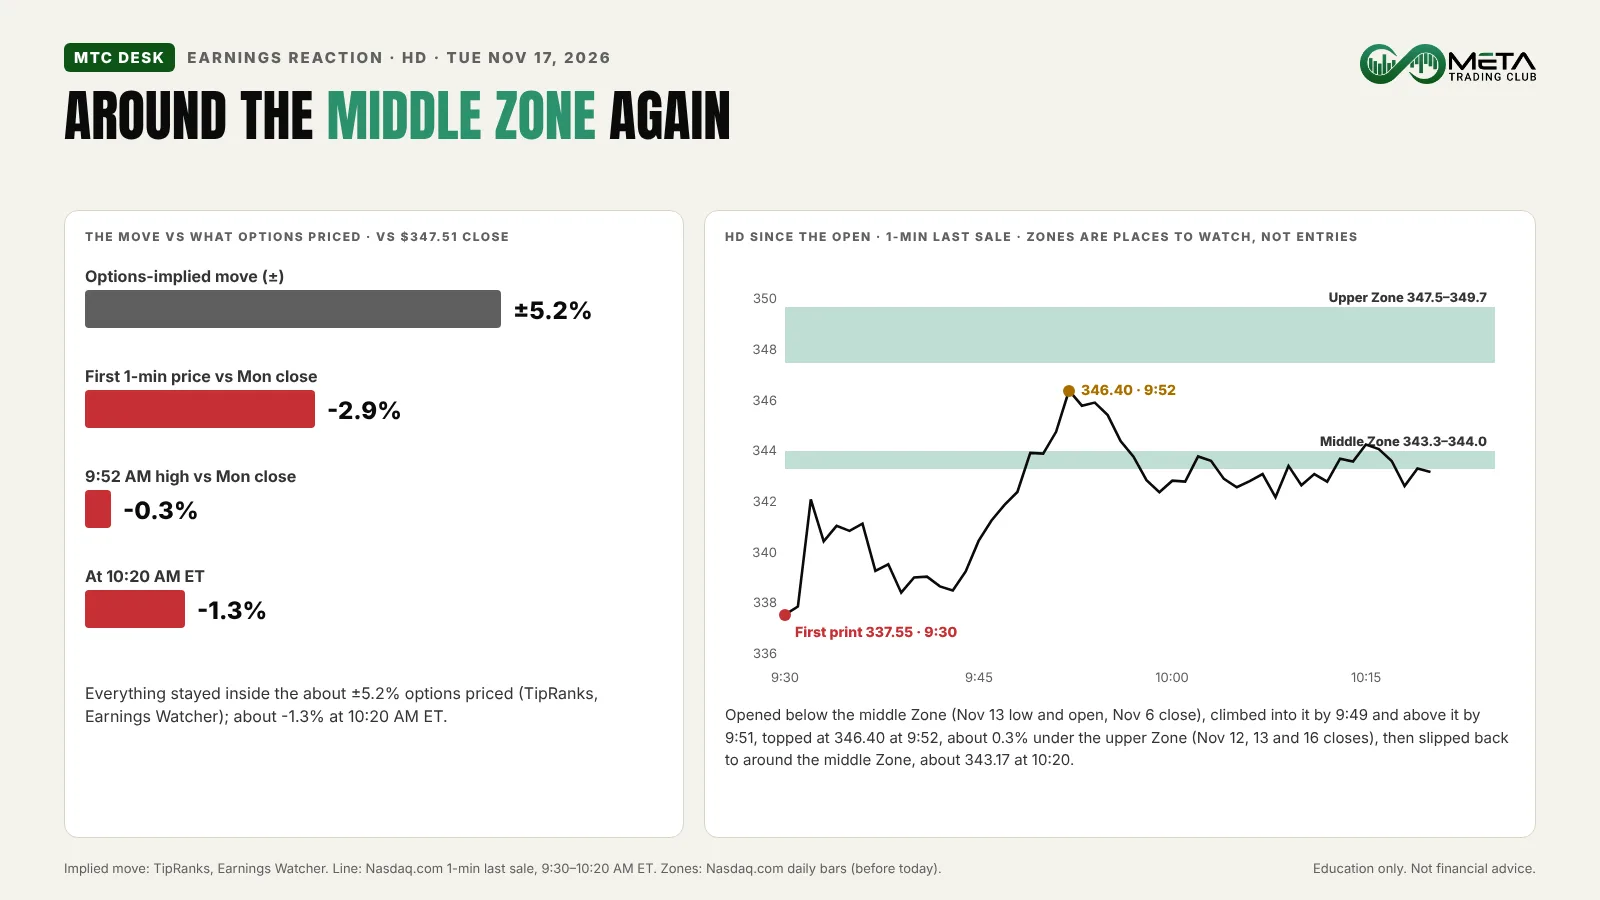
Before the report, TipRanks and Earnings Watcher both put the options-implied move at about ±5.2%. That is the swing traders were paying for, in either direction. Home Depot (market cap about $342 billion, Nasdaq.com) reported this morning before the open.
- Monday close: $347.51 (Nasdaq.com).
- Premarket: a range of about $333.10 to $349.50 between 4:00 and 9:29 AM ET (Nasdaq.com).
- First 1-minute price: about $337.55 at 9:30 AM ET, about 2.9% lower.
- 9:52 AM high: about $346.40, about 0.3% below Monday’s close.
- At 10:20 AM ET: about $343.17, about 1.3% lower (Nasdaq.com).
A number above estimates does not guarantee a rise; we cover how to read earnings reactions in how to trade earnings season.
What the stock did at the Zones
Zones are areas where price reacted on earlier days, places to watch for a reaction, not entries. Today’s own open, low, high and premarket prints are not Zones. We read three off the daily bars (see support and resistance trading for the method):
- 347.5–349.7: the November 16 close ($347.51), the November 12 close ($348.26), the November 13 close ($348.69) and the November 16 high ($349.73).
- 343.3–344.0: the November 13 low ($343.26) and open ($344.00), and the November 6 close ($343.47).
- 333.0–334.1: the November 2 low ($333.00) and open ($334.08), and the November 3 close ($333.66).
HD opened about $337.55, below the middle Zone and above the lower one. It climbed into the middle Zone by about 9:49 AM ET, was above it by 9:51, and reached about $346.40 at 9:52, about 0.3% under the upper Zone, without getting in. It then slipped back and spent 10:00 to 10:20 AM around $342.20 to $344.30, in and out of, and just under, the middle Zone, at about $343.17 at 10:20. That is a reaction at the upper Zone, not a confirmation: we would want to see what price does next at 343.3–344.0 and at 347.5–349.7 before reading anything into it.
For the bigger picture, see the Nov 17 premarket brief and yesterday’s Nov 16 close recap.
What Home Depot reported
Third quarter fiscal 2026, released Tuesday, November 17, before the open (company release):
- Sales $43.4 billion, up 4.9%, against about $42.8 billion expected (TipRanks, StockStory): above.
- Adjusted EPS $3.86, up from $3.74, against $3.84 expected (TipRanks, StockStory): above, narrowly. GAAP EPS $3.72, up from $3.62. Net earnings $3.7 billion.
- Comparable sales +2.2%, and +2.2% in the U.S.
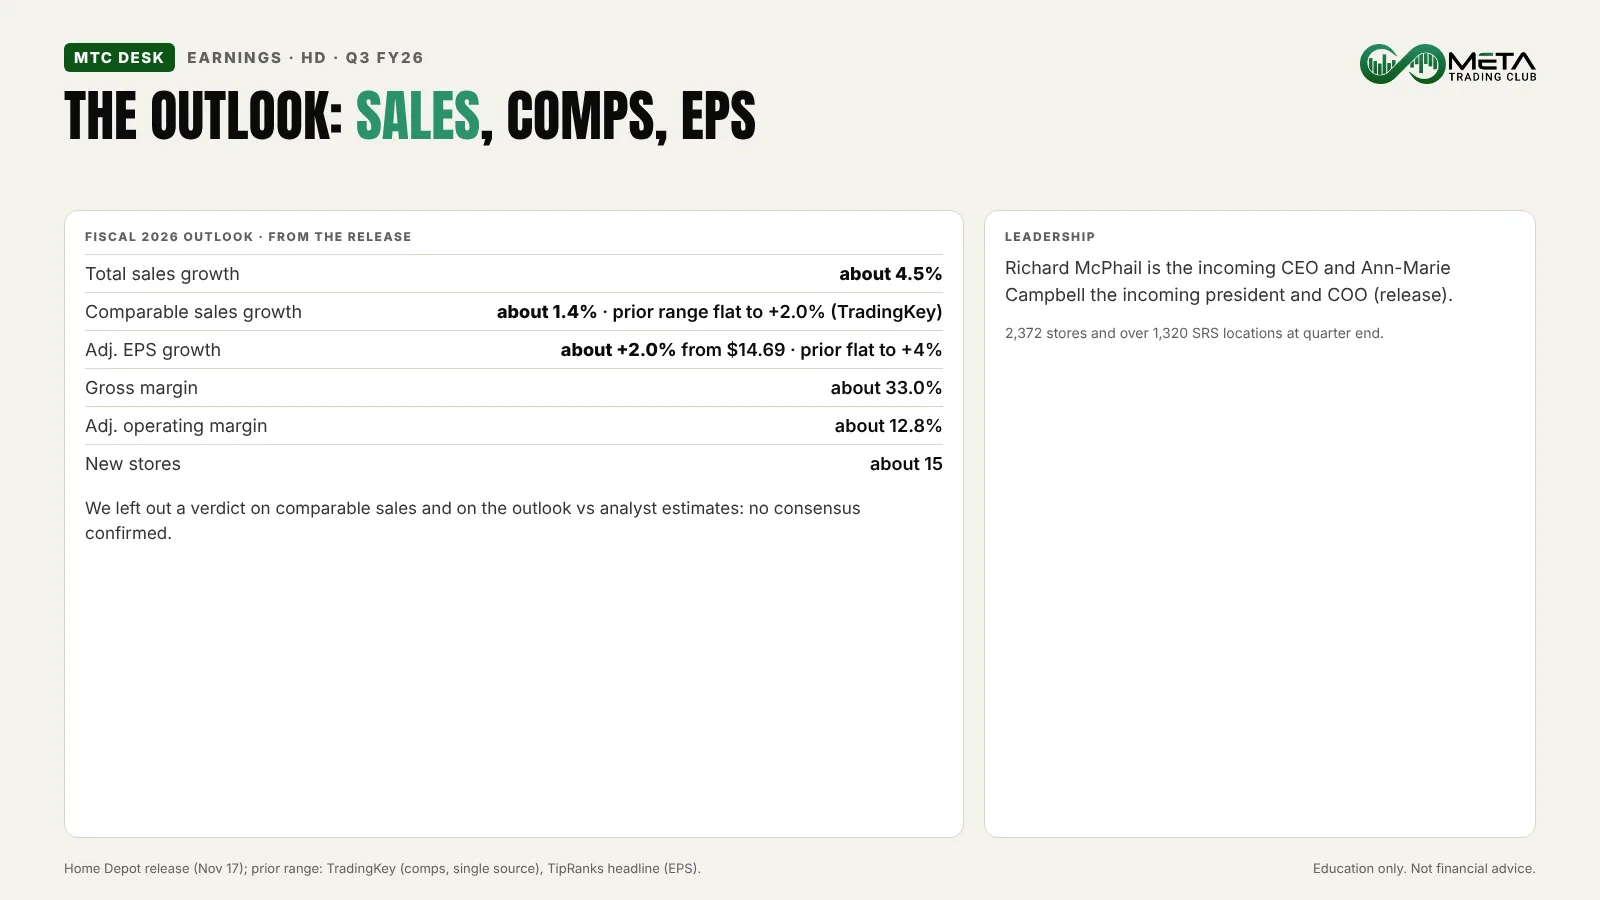
- Richard McPhail is the incoming CEO and Ann-Marie Campbell the incoming president and COO. At quarter end the company operated 2,372 retail stores and over 1,320 SRS locations.
Guidance
- Total sales growth of about 4.5%; comparable sales growth of about 1.4% (the prior range was flat to up 2.0%, TradingKey, single source).
- Adjusted EPS growth of about 2.0% from $14.69; gross margin about 33.0%; adjusted operating margin about 12.8%; about 15 new stores.
We left out a verdict on comparable sales and on the outlook against analyst estimates: we could not confirm a consensus. We also do not give a reason for the stock move, because the sources we read do not name one.
What it teaches
A report that lands above estimates can still meet a lower stock, and the open often sits well away from where the day settles. What matters next is how price behaves at the Zones. Here the open was below the middle Zone, price climbed back through it within 20 minutes, stopped just under the upper Zone, and returned to it. Mark the Zones above, wait for price to reach one, and let confirmation come to you.
No alignment, no trade.
FAQ
Home Depot reported on November 17, 2026 before the open. HD’s first 1-minute price was about $337.55, about 2.9% below Monday’s $347.51 close, it reached about $346.40 at 9:52 AM ET, and it was about $343.17, about 1.3% lower, at 10:20 AM ET (Nasdaq.com). All of that stayed inside the about 5.2% move options had priced.
Yes, above on both lines, narrowly on EPS. Sales were $43.4 billion against about $42.8 billion expected and adjusted EPS was $3.86 against $3.84 expected (TipRanks and StockStory, citing S&P). We left out a verdict on comparable sales and on the outlook against analyst estimates because we could not confirm a consensus.
Per the company release, Home Depot now expects total sales growth of about 4.5%, comparable sales growth of about 1.4%, gross margin of about 33.0% and adjusted EPS growth of about 2.0% from $14.69. TradingKey lists the prior comparable sales range as flat to up 2.0%, a single source.
The implied move is the size of the price swing the options market is pricing for an event like earnings, in either direction. TipRanks and Earnings Watcher both put Home Depot’s at about 5.2%; the first print and the 9:52 AM high both stayed inside it.
Sources: Home Depot Q3 fiscal 2026 results, company release (SEC Form 8-K Ex. 99.1, Nov 17); TipRanks and StockStory/S&P (estimates), TipRanks and Earnings Watcher (implied move), TradingKey (prior comparable sales range, single source); Nasdaq.com (1-minute prices, daily bars, market cap); Finviz (chart). Prices are approximate and carry their time. Featured image: AI-edited from a Wikimedia Commons photo by MatthewHoobin (CC0). Left out: a verdict on comparable sales and on the outlook vs consensus, and any single reason for the move.
Education only. Not financial advice.