
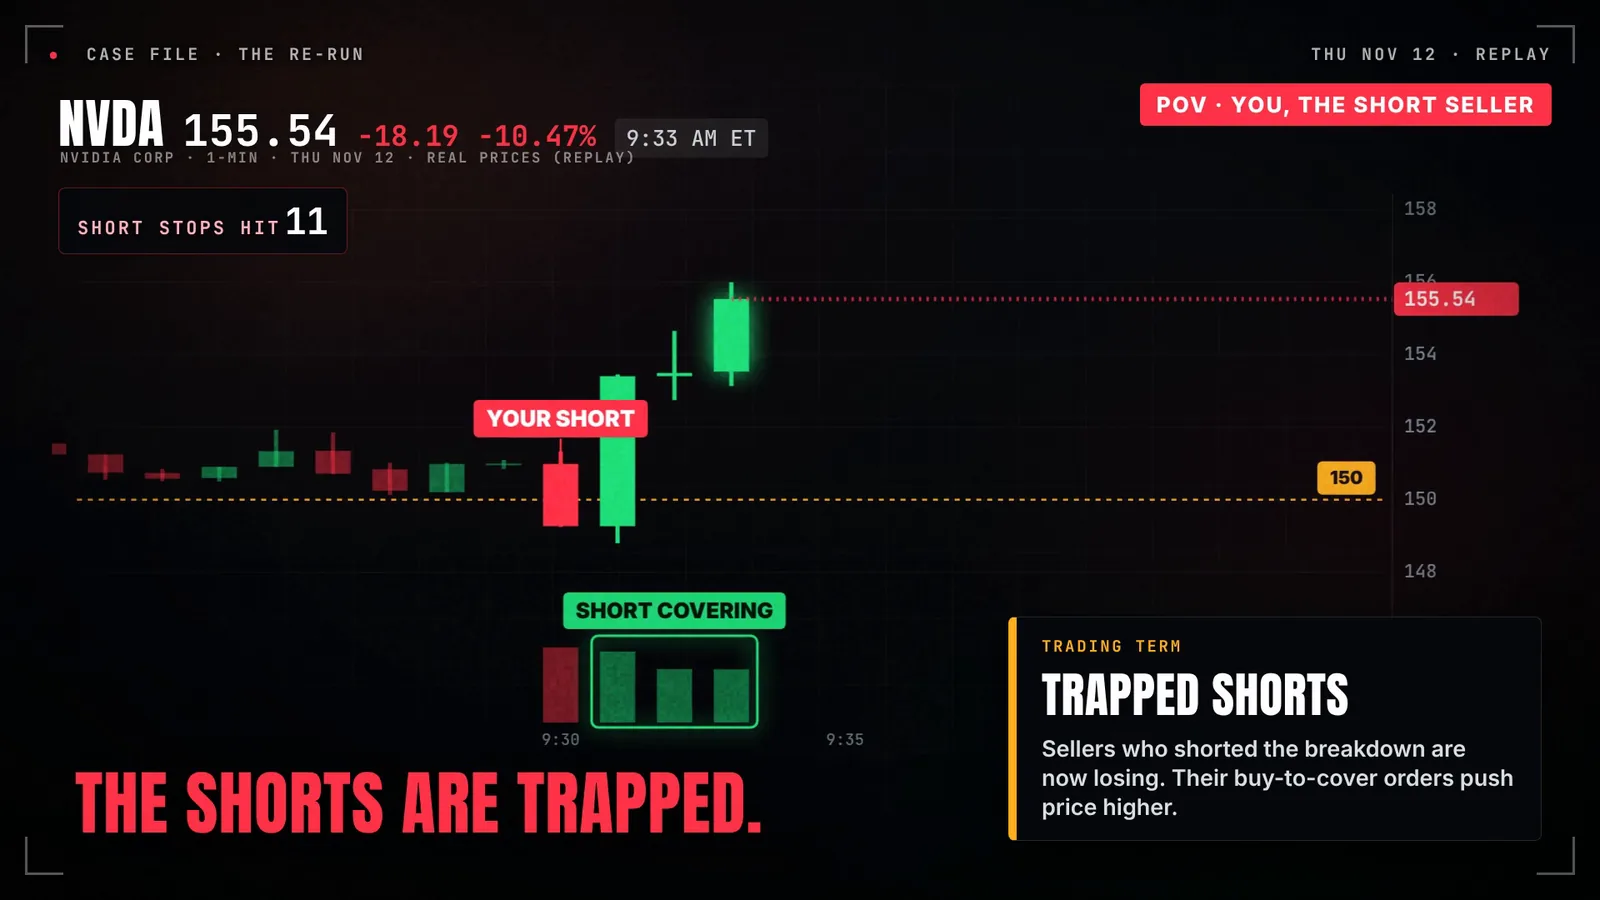
The Nvidia short trap happened on Thursday, November 12, 2026. Jensen Huang resigned, Nvidia opened about 14% lower, broke $150 and dipped to $148.80. Traders who shorted that break got trapped: price swept the stops under $150, reclaimed the level within minutes, and short covering pushed it almost 9% off the low.
Everyone saw the same headline. CEO out, an affair, a board probe about a foreign intelligence effort. So most people did the obvious thing and sold.
I didn’t. Thirteen minutes before the open I marked one Zone on my chart, 150 to 153, and told our live room I didn’t want to get caught shorting into it. Then I waited for price to prove it.
This post is the written version of this week’s video. The story, what the chart did, why the shorts got trapped, how I traded it live (including the trade that went nowhere and the loss earlier in the week), and the one rule I use so a headline never traps me.
Key takeaways
- Nvidia fell as much as about 14% at the open, swept below $150 to $148.80, then reclaimed the level within minutes and closed the day down 4.34%.
- The shorts who sold the break became the fuel. Their stops and their buy-to-cover orders pushed price higher.
- My Zone (150–153) was marked before the open. The trigger was the sweep plus a reclaim and hold, not the headline.
- Calls in at 9:39 AM, fully out at 9:44 AM: contracts went from $2.00 to about $2.90. The re-entry right after was break even (0R).
- The rule: never trade the headline. Trade the level, and wait for price to prove it.
What happened at Nvidia? The story in brief
This story moved fast, so here it is in order, with who said what.
Sunday, Nov 8. Huang sent a staff email apologizing for being “unfaithful to my wife,” according to the Associated Press. The same day, Nvidia said it was investigating whether he had been “the target of a foreign intelligence effort.” The company also said it had “no reason to believe” national security or Nvidia secrets were compromised (AP).
The report behind it. The New York Times had reported the month before that U.S. intelligence suspected a woman Huang was involved with of passing information to Beijing, as AP recounts it. China’s Foreign Ministry called the allegations “unsubstantiated.” None of it has been proven, and no one has been charged. It is a reported claim, not a finding.
Wednesday, Nov 11. The Wall Street Journal reported that the board was preparing to push Huang out. Nvidia fell about 8% after hours (Stock Analysis, citing the Journal).
Thursday, Nov 12. The filing. Nvidia’s 8-K says Huang resigned as President, CEO and a member of the board, effective immediately. CFO Colette Kress became interim CEO while keeping the CFO job, Harvey C. Jones became the company’s first-ever Chair of the Board, and the board started a search for a permanent CEO. President Trump, who had called Huang an “honorable guy” over the weekend, said Thursday that he had “done a fantastic job” (AP).
For the company that makes the chips every AI lab wants, that is about as ugly as a headline week gets. Our Thursday close recap covers the full market day.
But the wildest part wasn’t the scandal. It was what the chart did at 9:30.
If you’d rather watch it than read it, the full video replays the whole morning candle by candle, with my live audio from the room. And if you’re not sure yet what kind of trader you are (scalper, day trader, swing), take the free Trading Profile Quiz. Two minutes, and you get an education plan built around your answers.
What did NVDA do on Thursday morning?
Wednesday’s official close was $173.73. Thursday, Nvidia opened at $149.29. That’s a gap of about 14% before a single regular-session trade.
Right at the open, $150 broke. Price dipped to $148.80, the low of the day, about 14.35% under Wednesday’s close. It looked like the floor had just given out.
Then it snapped back. Within a couple of minutes Nvidia was back above $150 and through the top of the 150–153 area. By 9:41 AM it had printed $161.94, about 8.8% off the low. It finished the day at $166.19, down 4.34%, after a high of $167.14 (Nasdaq official close; Yahoo Finance 1-minute data).
Same headline all day. Totally different trade depending on where you sold.
How does a short-seller trap work?
Let’s re-run the morning as the short seller. Five terms explain the whole thing.
1. The gap. The stock opens far from where it closed. A gap this size means the panic already happened overnight. A lot of the selling is done before you even click.
2. The liquidity sweep (stop run). $150 was the obvious line. Every buyer from the prior days had a stop just under it, and every breakdown trader had a sell order waiting there. Price ran under it to $148.80, filled all of those orders, and ran out of sellers. That’s a sweep.
3. The reclaim. Price gets back above the level it just broke, and stays there. Now the breakdown failed.
4. Trapped shorts. Everyone who sold at 149 or 148 is now losing money, with their stop sitting right above them.
5. Short covering. To get out of a short, you have to buy. Those buy-to-cover orders push price up, which hits more stops, which forces more buying. The people who sold the breakdown became the fuel.
If short selling itself is new to you, start with what short selling is and how it works. The trap only makes sense once you know a short has to buy to close.
The trap in one line
Most traders don’t lose on headline crashes because they read the news wrong. They lose because they short the panic right at the low, into a level where buyers already showed up before.
How I traded the Nvidia short trap live
Here’s the same five minutes through my eyes.
Before the open: the Zone. At 9:17 AM, live with members, I said Nvidia was sitting in a whole demand area and I wanted to see how price opened and reacted there, because I didn’t want to get caught in a possible trap shorting it. A few minutes later I gave the levels: demand 150–153, resistance 165. That Zone comes from prior structure. It’s where buyers stepped in before.
At 9:30: wait. When 150 broke, I said it on the stream: “Don’t chase, guys. Wait for the confirmations.” A level breaking isn’t a reason to trade by itself. I don’t short into my own Zone. I wait for proof.
The trigger: sweep + reclaim + hold. Price takes out the low, gets back above the Zone, and holds there on a candle close. Then I wanted a pullback that held, so I had confirmation the move would continue. That’s why I didn’t take the first green candle.
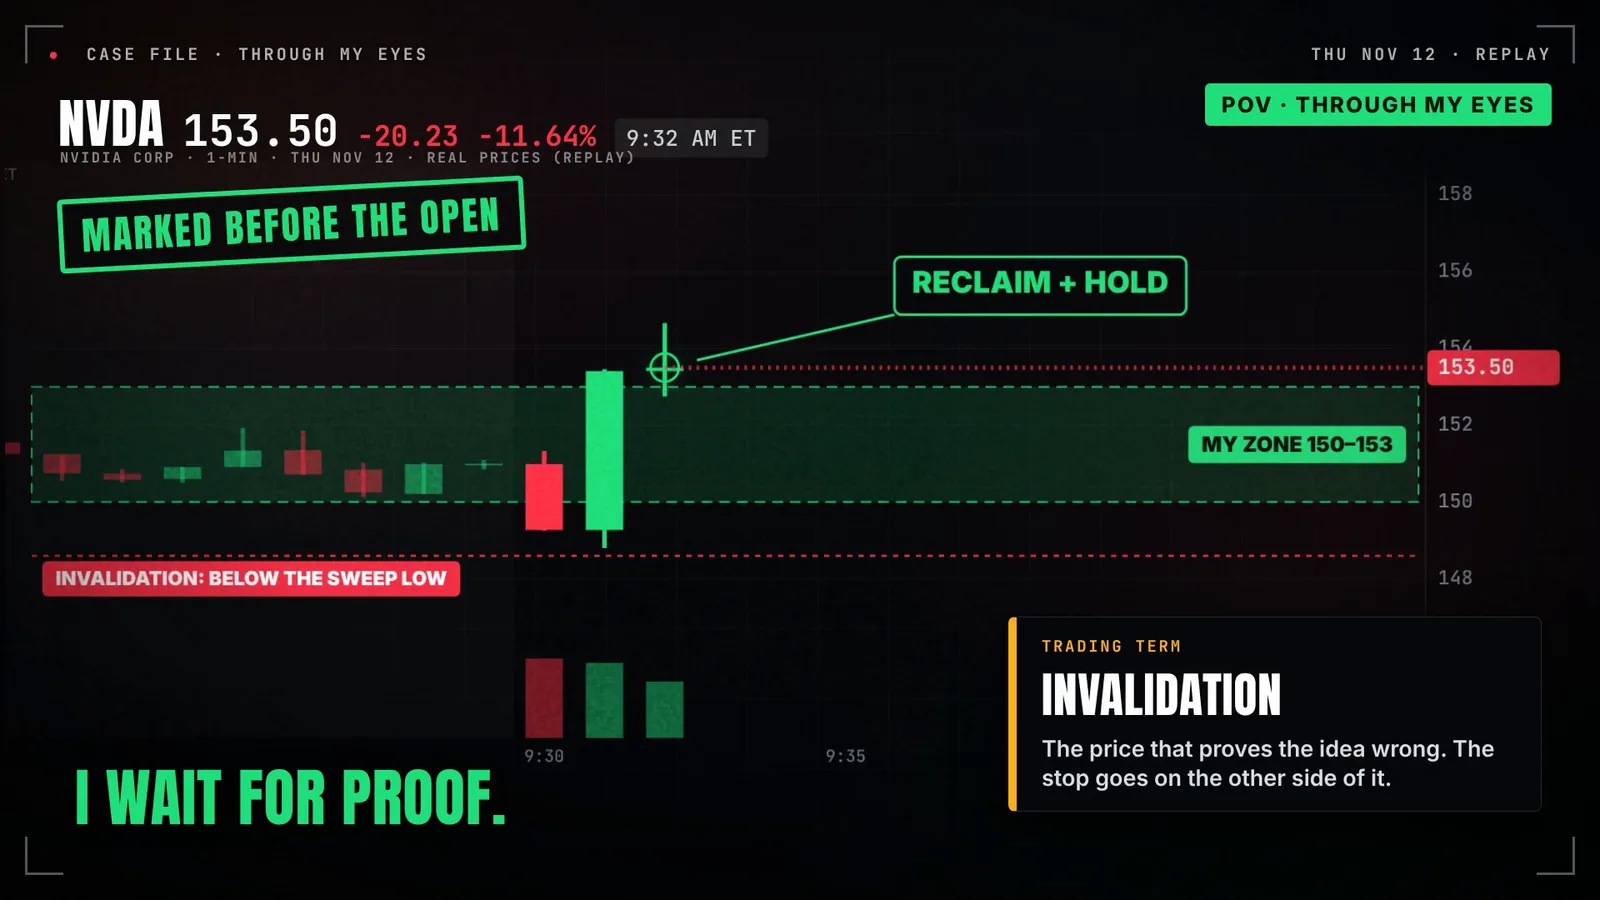
Invalidation. If price goes back under the sweep low, the idea is wrong. Simple. The stop belongs on the other side of the sweep, not somewhere that just feels comfortable.
Size to the stop (1R). The distance from entry to invalidation is one R, the most I’m willing to lose on the idea. A wide stop means a smaller size. Never the other way around.
MTC Analysis · Hypothetical example
Illustrative numbers only, not my actual size or risk on this trade.
Say your 1R is $200. You enter on the reclaim at $153.50 and your invalidation is just under the sweep low, at $148.50. That’s $5.00 of risk per share.
$200 ÷ $5.00 = 40 shares. If the stop were only $1.00 away, the same $200 would buy 200 shares. Different size, same 1R.
With options it works the same way: decide what the position loses if price goes back under the sweep low, and size the contracts so that number is your 1R. Our free position size calculator does the math for you.
The entry. At 9:39 AM I said it live: “I am entering NVDA calls here.” The plan was to scale out as price pushed toward first resistance, 163–165.
The exit. It never reached that resistance. It got rejected first, so I scaled out and was fully out at 9:44 AM. The contracts went from $2.00 to about $2.90.
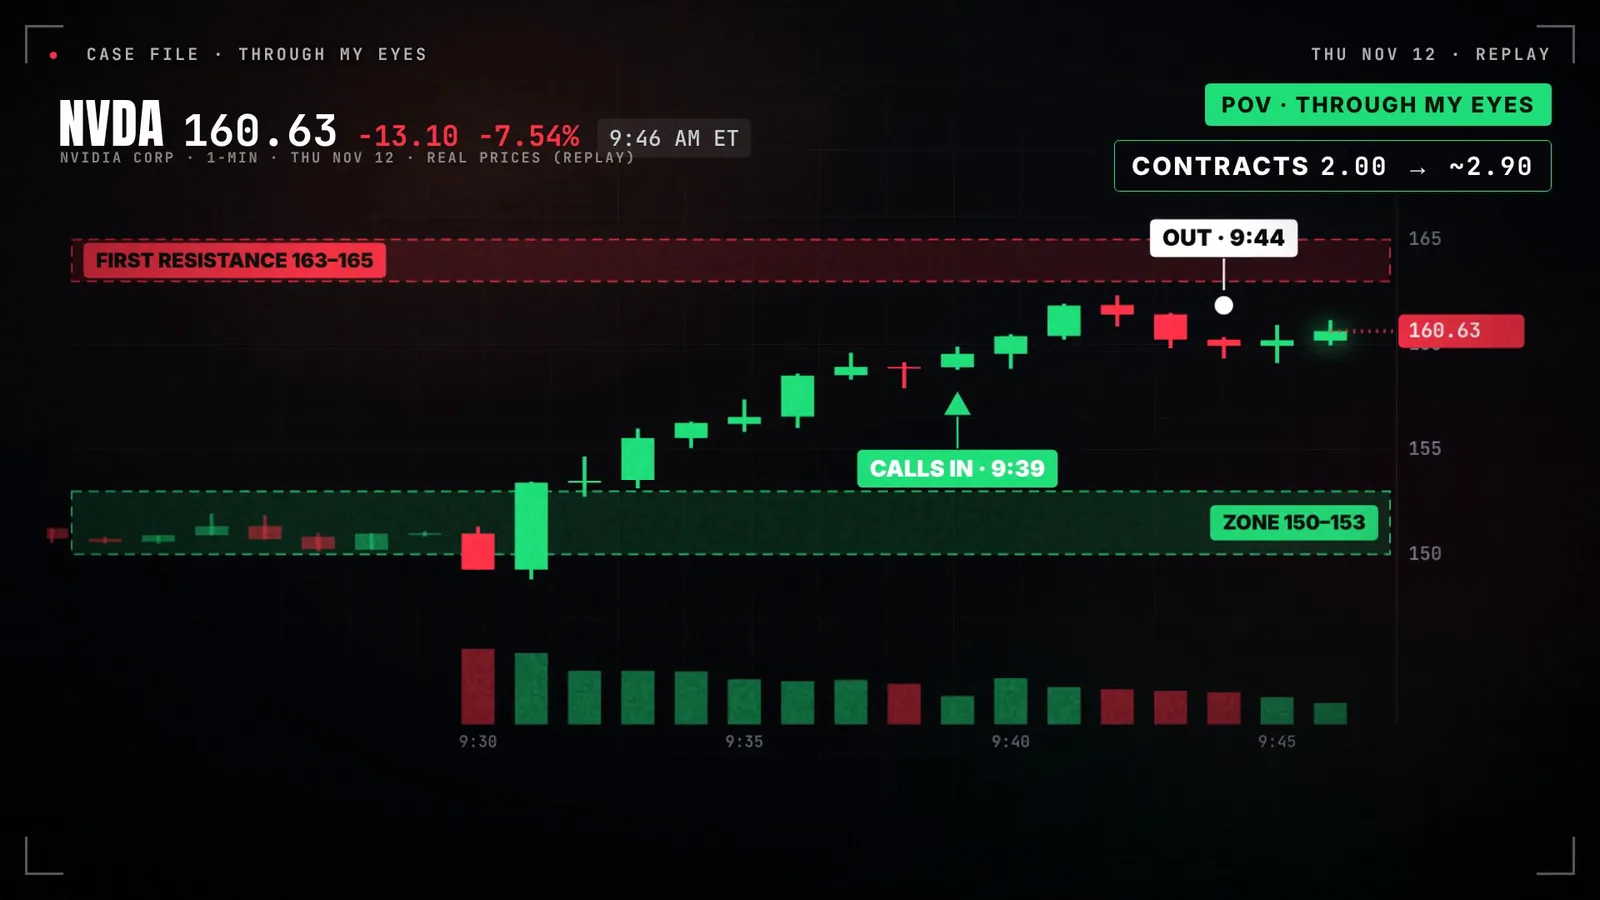
Why not hold for more? ATR. Average true range is how far a stock normally moves in a day. Nvidia’s was about $9. Thursday’s range, $148.80 to $167.14, was over $18. That’s about double a normal day. When a stock has already moved that much, I don’t ask it for more.
This is what we do live, 4 days a week.
The Zone gets marked before the open, then we wait for price to prove it, together, in real time. If you want to sit in the room for the next one, start the 7-day free trial of the MTC Community: the daily game plan, live trading Monday, Tuesday, Thursday and Friday, and two webinars a week.
Nvidia reports on Tuesday. That’s the next one.
The part nobody shows you
Three minutes after I got out, I went back in. Same stock, same idea. In at 9:47, out at 9:48. That one ended at break even, 0R.
Wins make you careless. After a clean trade you feel like the market owes you another one. It doesn’t. The second trade wasn’t a disaster, but it wasn’t the setup either. It was me wanting more.
And on Tuesday I took a real loss on AMD. I entered AMD calls at about 10:22 AM and got out at about 10:36, live: “I’m out of AMD. Taking this loss.” A loss is part of the job. What matters is the next trade.
Day 2: why I bought Nvidia puts on Friday
Friday was the same story in the other direction. Nvidia opened near $170. Then 165, the resistance I gave Thursday morning, broke at about 9:35. The bounce back up failed and rolled over.
Same playbook. I waited for the failed bounce, then took NVDA 160 puts at 9:48. I started taking profits at 9:50 and was fully out at 9:51. Puts, green. Nvidia closed Friday at $162.85, down 2.01%, and down about 12.8% for the week.
Two days, same idea: let the level fail or hold first, then act. The Friday close recap has how the rest of the chip group traded that day.
The week’s record, honestly
These are closed trades from our live sessions, Nov 10–13, where I stated the result on the stream.
| Day | Trade | Result |
|---|---|---|
| Tue | NVDA puts | Green |
| Tue | AMD calls | Loss |
| Tue | QQQ puts | Green |
| Thu | NVDA calls (the trap trade) | Green, contracts $2.00 → about $2.90 |
| Thu | NVDA calls re-entry | Break even (0R) |
| Thu | GOOGL 300 calls (right after the session) | Green |
| Fri | NVDA 160 puts | Green |
| Fri | QQQ breakout scalp | Green |
6 green, 1 loss, 1 break even. I didn’t state the R on most of these live, so there’s no R total and no dollar total this week, and a few trades where I never said the result live aren’t counted. Past results don’t guarantee future results.
The rule: never trade the headline, trade the level
Don’t ask what the news means. Ask where the level is.
- Mark your Zone before the open. From prior structure, where price reacted before. Not from today’s panic.
- Wait for the sweep and the reclaim, on a candle close. Or a clean break that holds the other way. Let price prove it.
- Stop on the other side, with small size. Invalidation decides the stop; the stop decides the size.
Inside our community we call the full version of this the Alignment Engine: Bias, Zone, Reaction, Confirmation, Execution. These three steps are the simple version, and they’re enough to keep you out of the trap.
What’s next for Nvidia: earnings on Tuesday, Nov 17
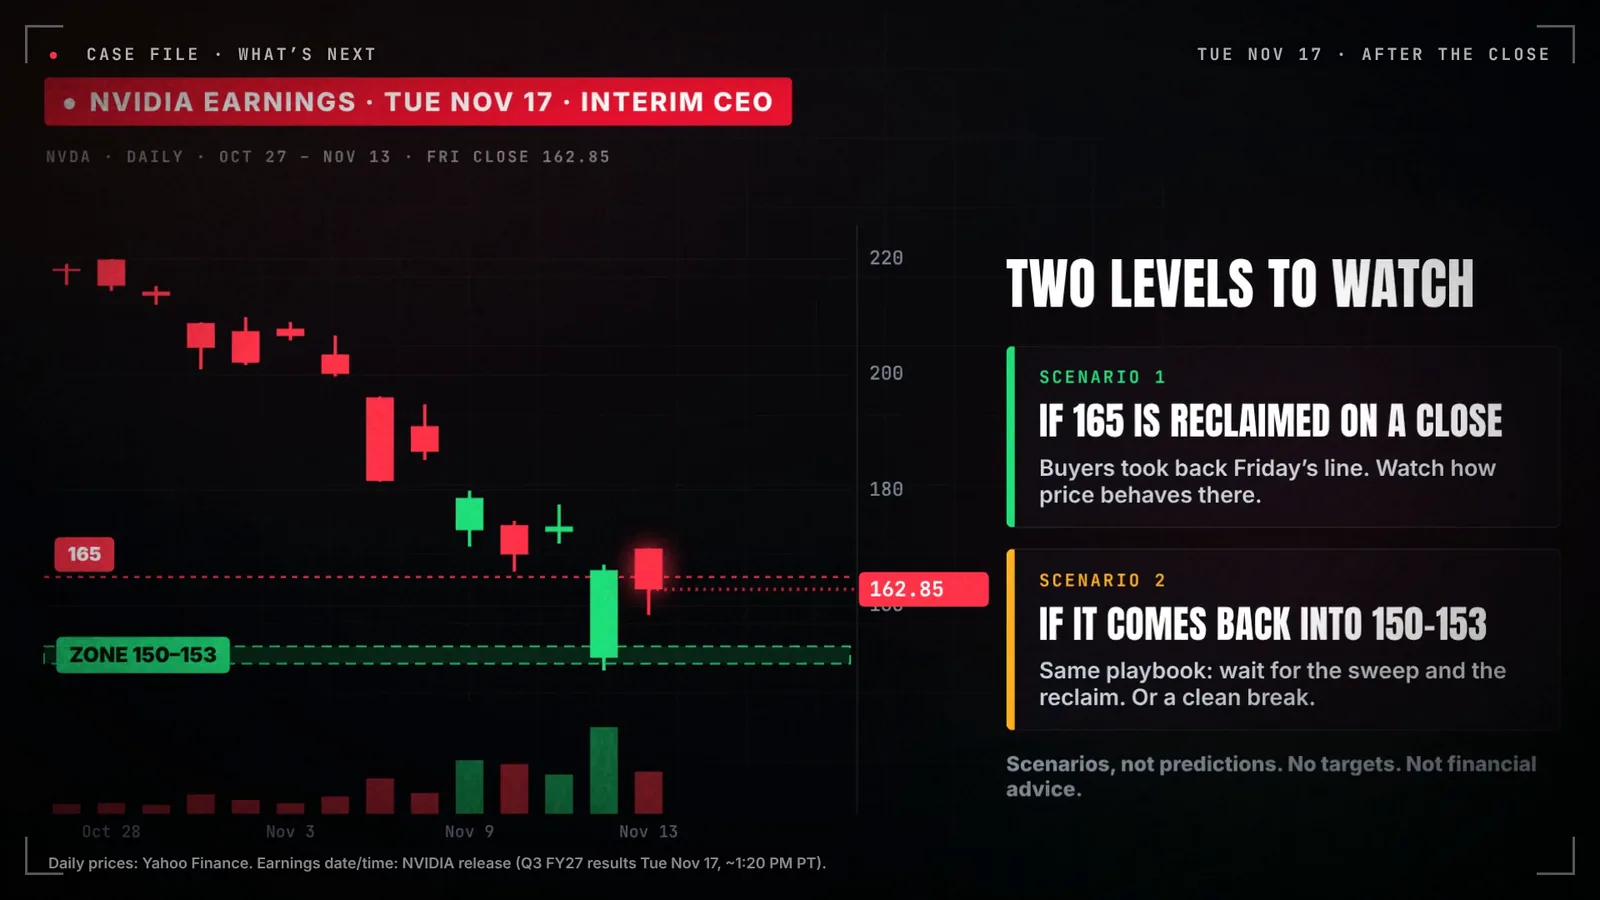
Nvidia reports after the close on Tuesday, November 17, with an interim CEO. Here are the two levels I’m watching, as scenarios, not predictions.
Scenario 1: 165 gets reclaimed on a close. That means buyers took back Friday’s line. Then I watch how price behaves above it.
Scenario 2: price comes back into 150–153. Same playbook as Thursday. Wait for the sweep and the reclaim, or a clean break that holds.
An earnings report on top of a CEO change can gap the stock either way. That’s exactly when the rule matters most.
Get next week’s Zones before Monday
Every Sunday I send The Sunday Setup, a free newsletter with next week’s Zones, the calendar and one lesson. This week’s issue is built around Nvidia earnings.
Want to go deeper first? Grab the free education pack: sample lessons, the eBook and a 7-day pass. And the full video is on YouTube if you want to watch the trap play out.
FAQ
Sources: NVIDIA Corp. Form 8-K and press release, SEC EDGAR (Nov 12, 2026); Associated Press (Nov 12, 2026, via The Boston Globe), including the New York Times report as recounted by AP and China’s Foreign Ministry response; The Wall Street Journal report as reported by Stock Analysis (Nov 11, 2026); price data from Nasdaq.com official closes and Yahoo Finance (1-minute and daily); weekly index changes from AP. Trades: Meta Trading Club live sessions, Nov 10–13, 2026, as logged in our track record. Charts are stills from this week’s video, built from real prices. Featured image: the video’s thumbnail (Jensen Huang photo: NVIDIA Newsroom, official).
Real closed trades from MTC live sessions. Past results don’t guarantee future results. Education only. Not financial advice. Trading involves risk of loss.