The Sunday Setup · Trading week ending October 16, 2026 · ~7 min read
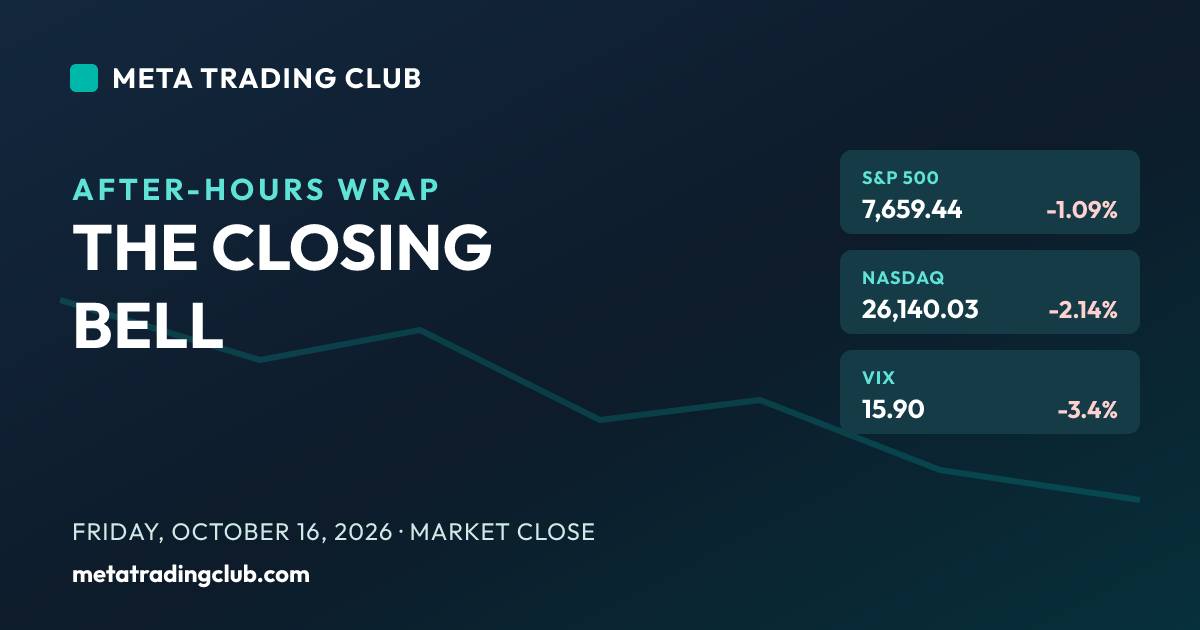
For months the market shrugged off everything — hot inflation, higher-for-longer rates, a narrowing list of leaders. This week it finally flinched. The S&P 500 fell 1.9% and the Nasdaq dropped 4.5%, both their worst week since June.
It didn’t come from the Fed or an inflation print. It came from the banks. Two regional lenders disclosed bad loans, the regional-bank ETF had its worst day since 2023, and the AI names that carried the whole year led the tape straight back down. Money didn’t vanish — it ran. Into gold, into Treasuries, into the VIX, which jumped from 15 to 20 in a week.
Here’s the part that matters for next week: the indices flinched, but they held. The S&P and Nasdaq both closed under their short-term averages and above their 200-day. That line is the whole argument — dip or turn. This week: the market finally flinched.
The Scoreboard
Red almost everywhere, and the leaders bled the most. The Nasdaq’s 4.5% drop was the tell — the tech-heavy index fell more than twice the S&P because the names doing the heaviest lifting all year became the heaviest weight. Only the Dow, light on tech, held green.
| Index | Close | Week | YTD |
|---|---|---|---|
| S&P 500 | 7,659.44 | ▼ −1.9% | +11.9% |
| Nasdaq Composite | 26,140.03 | ▼ −4.5% | +12.5% |
| Dow Jones | 52,002.41 | ▲ +0.7% | +8.2% |
| Russell 2000 | 2,721.37 | ▼ −3.0% | +9.6% |
Macro: 10-YR yield 5.10% (−15 bps on the week, its biggest weekly drop since February) · VIX 19.99 (up from 14.84 — fear woke up) · Gold ~$4,181 (near a record) · Dollar (DXY) ~101.8 (firm). Yields reflect the flight-to-safety bid; the 10-year falling while stocks fall is the bond market pricing risk, not relief. A hold at the October 28–29 Fed meeting is priced near the mid-80s percent, with a smaller chance of one more hike and no cut on the table.
Notice what led higher: the safe stuff. Gold near a record, Treasuries bid, the dollar firm. When money leaves stocks but doesn’t leave the market, it tells you this was a rotation into safety, not a liquidation. That distinction is the whole map for next week.
The Tape
Three charts framed the flinch. Levels, not predictions.

SPY — S&P 500 ETF, daily. The first crack in a clean uptrend. SPY closed Friday at 763.25, back under its 20-day (771.18) and 50-day (768.50) for the first time since the summer breakout — but still well above the rising 200-day at 725.91. That’s the frame: short-term structure broke, long-term trend intact. First resistance is the 768–771 average cluster the index now has to reclaim; support sits far below at the 200-day near 726. Nothing here is broken yet. It’s a pullback in an uptrend — until 726 says otherwise.

QQQ — Nasdaq 100 ETF, daily. The steepest flinch of the three. QQQ finished at 709.80, below both its 20-day (742.52) and 50-day (726.77) after leading the tape down — the same mega-cap AI names that dragged it to records in September now dragging it back. The 200-day sits at 674.91, still comfortably below price, so the uptrend’s backbone holds. But the gap between Friday’s close and the fast averages is wide: this chart has real repair work before it’s a buy. Reclaim 727 and the leaders are back; lose 675 and the whole AI trade is in question.

KRE — Regional Bank ETF, daily. The one that broke first. KRE closed at 69.81 — below all three of its moving averages: the 20-day (70.06), the 50-day (72.94), and the 200-day (70.73). While the index charts above are pullbacks holding their long-term trend, the banks already lost theirs. This is what leading down looks like on a chart. The sector that sparked the whole scare is the one with the most broken structure, sitting on 68 support with the 72–73 cluster now resistance overhead. Watch this one closely — the banks told the story before the index did.
Decoded: The Two Forces That Broke the Calm
1. The crack in credit — the banks broke first
The selloff didn’t start with the Fed or an inflation number. It started Thursday when two regional banks disclosed problem loans, and the market’s reaction told you how nervous it already was under the surface.

Imbalance: a credit scare is different from a growth scare. It hits the part of the system that lends to everyone else, so the fear spreads faster than the actual numbers justify. One bad-loan disclosure becomes “what else is hiding on these balance sheets,” and the whole sector gets sold before anyone has the answer.
Positioning: you don’t trade the headline, you trade the level. KRE already lost all three moving averages — that’s a sector in confirmed weakness, not a dip to catch. Watch whether the scare stays contained to a few names or bleeds into the money-center banks. The regionals are the canary; the 68 level on KRE is the line that says contained or contagious.
The tell in the tape: credit cracks before earnings do. When the lenders lead down, the market stops asking about growth and starts asking about solvency — and that question gets priced fast.
2. The AI trade wobbled — the leaders became the weight
The Nasdaq’s 4.5% drop wasn’t broad. It was concentrated in exactly the names that drove the year — the AI and semiconductor complex — and that concentration is why the index fell more than twice as hard as the Dow.

Micron slid roughly 5% and CoreWeave dropped about 12% as the “is AI a bubble” conversation came back to the front page. This is the risk of narrow leadership working in reverse: when a handful of giant names carry an index up, that same handful can carry it down twice as fast, because there’s no broad base underneath to cushion the fall. The melt-up and the flinch are the same structure, pointed in opposite directions.
Imbalance: a cap-weighted index concentrates both the gains and the pain at the top. The same few names that printed September’s records did most of this week’s damage. Narrow strength is fragile strength — it cuts both ways, and this week it cut down.
Positioning: the long-term trend in the megacaps isn’t broken — QQQ still holds its 200-day. But the short-term structure is, and chasing a falling leader into no support is how good traders give back a good year. Respect the 200-day as the line that matters; let the fast averages be reclaimed before you call the pullback over.
Chart of the Week: NVDA Through the Engine
If you want one chart that captures the whole week, it’s the stock that has been the single biggest driver of this bull market. NVDA didn’t crash — but it lost the lines that defined its uptrend, and it did it right as the AI trade came into question. A perfect case for running the Engine instead of the emotion.

The leader lost its lines. NVDA closed Friday at 214.13, down 1.4% on the day and back under both its 20-day (228.18) and 50-day (223.08), still holding above the rising 200-day at 202.97. After leading the market higher all year, the stock has pulled under the fast averages that defined its trend — but it hasn’t touched the long-term line that would say the whole run is in trouble. Resistance is the 223–228 average cluster; support is the 200-day at 203. Here’s the sequence, run through the Alignment Engine:
1. Bias — the leader turned defensive. NVDA is the name that carried the tape, so when it rolls over it changes the whole market’s posture. The bias shifted from offense to defense this week. But a shift in bias is a reason to watch, never a reason to short a market leader blindly.
2. Key Level — stranded between fast and slow. Overhead, the 20- and 50-day cluster at 223–228 — the averages the stock just fell through, now resistance. Below, the 200-day at 203, the line that has supported every dip of this bull run. Price at 214 sits in the gap between them.
3. Reaction — broke down, no bounce yet. The stock sliced under its fast averages and closed near the lows of the move with no reclaim and no test of the 200-day. A leader falling through support with no reaction is a chart still looking for its floor. You don’t guess where that is.
4. Confirmation — none. No reclaim of the 223 average, no higher high, no bounce off the 200-day worth trading. The chart has broken short-term structure and given no signal that it’s done. No confirmation, no trade.
5. Execution — wait for the line that decides it. Reclaim 223 on volume and the pullback is over — the leader is back and you have a real long. Lose 203 and the 200-day breaks for the first time this cycle, which is a different, much bigger conversation. Until price picks one, the Engine’s answer is to stand aside.
Engine Teardown: The Banks Confirmed It First
Here’s the lesson buried in the week’s sequence, and it’s the heart of how we trade. The index didn’t warn you. The sectors did.
Confirmation — the fourth step of the Engine — isn’t just about a single chart reclaiming a level. It’s about the market agreeing with itself. And this week, the pieces lined up in order: the regional banks broke their moving averages before the S&P broke its first one. KRE lost all three averages while SPY was still sitting on fresh highs. The credit-sensitive corner of the market confirmed risk-off days before the headline index admitted anything was wrong.
The Global Line: Money Didn’t Leave — It Hid
The easy story is “stocks sold off, risk is off, get out.” But look at where the money went, because that’s the real tell.
Gold held near a record above $4,180. The 10-year Treasury yield fell 15 basis points — its biggest weekly drop since February — which means bonds were bought hard, because falling yields mean rising prices. The dollar stayed firm. The VIX jumped from 15 to 20. Every one of those is a flight-to-safety signal, and together they tell you this wasn’t a liquidation where everything gets sold. It was a rotation: money moved out of the risky, narrow, crowded trades and into the places it hides when it’s nervous.
The Week Ahead
Earnings season deepens into a nervous tape, and the Fed goes quiet. Frame these as things to watch, not predictions.
Regional bank earnings continue — after this week’s credit scare, every regional report is now a referendum on whether the bad loans are isolated or a pattern. This is the single most important read of the week. Mega-cap tech earnings begin to roll in — the AI names that led the flinch will have to defend their valuations with numbers, into charts that just broke short-term structure. Weekly jobless claims Thursday remain the real-time labor read. And this is the Fed’s last window of speakers before the pre-meeting blackout ahead of the October 28–29 decision — after this week, they go silent.
Two questions frame everything. Does the bank scare stay contained to a handful of names, or does next week’s regional earnings turn one disclosure into a theme? And can the AI leaders find a floor before they test their 200-days, or does the wobble become a real correction? One more: watch whether the VIX holds above 20 into the weekend — fear that sticks is different from fear that spikes and fades.
The watchlist — levels we’re marking
| Ticker | Resistance | Support |
|---|---|---|
| SPY | 771 | 726 |
| QQQ | 727 | 675 |
| KRE | 73 | 68 |
| NVDA | 223 | 203 |
These are levels, not predictions. The reaction at them is where the trade lives. Watch KRE’s 68 and QQQ’s 675 in particular — those are the lines that tell you whether this was a one-week flinch or the start of a real correction. The 200-day on the indices is the whole argument: hold it, and this is a dip; lose it, and the conversation changes. Mark them before Monday’s open, not after the next bank headline. Don’t guess it. Mark your levels and trade the reaction.
See the flinch before the index does. Then trade it, live.
Every morning, the MTC room walks the indices, checks the credit-sensitive corners, marks the levels, and builds the watchlist — then trades it in front of each other, wins and losses logged either way. That’s how you learn to read the edges of the market instead of getting surprised by the middle. Build the skill, and learn to tell a flinch from a fall.
Frequently Asked Questions
Why did the stock market fall the week of October 12, 2026?
In the trading week ending October 16, 2026, the S&P 500 fell 1.9% to 7,659.44 and the Nasdaq Composite dropped 4.5% to 26,140.03, both their worst week since June. The selloff was triggered by a regional-bank credit scare — two lenders, Zions and Western Alliance, disclosed soured business loans, sending the KRE regional-bank ETF down 6.2% on its worst day since 2023 — and compounded by a selloff in the mega-cap AI and semiconductor names that led the market all year. Money rotated into safety: gold held near a record, the 10-year Treasury yield fell 15 basis points on a flight-to-safety bid, and the VIX jumped from about 15 to 20. The Dow, light on tech, held green (+0.7%) while the tech-heavy Nasdaq fell more than twice as hard as the S&P.
What happened with the regional banks (KRE) in October 2026?
Two regional banks disclosed problem loans in mid-October 2026: Zions Bancorporation fell roughly 13% and Western Alliance roughly 10% after flagging soured business loans. The KRE regional-bank ETF dropped 6.2% on Friday, October 16 — its worst single day since 2023 — and closed at 69.81, below all three of its moving averages (20-day 70.06, 50-day 72.94, 200-day 70.73). A credit scare spreads faster than the underlying numbers justify because it raises the question of what else might be hiding on bank balance sheets. The key level to watch is 68 support on KRE, which signals whether the scare stays contained to a few names or bleeds into the broader banking sector.
Is the AI trade over after the October 2026 selloff?
The AI and semiconductor complex led the Nasdaq to its worst week since June, with Micron down about 5% and CoreWeave about 12% as “AI bubble” concerns resurfaced. But the long-term trend is not broken: QQQ, the Nasdaq 100 ETF, closed at 709.80 — below its 20-day (742.52) and 50-day (726.77) averages but still well above its rising 200-day at 674.91. NVDA, the market’s biggest driver, closed at 214.13, under its fast averages but holding above its 200-day at 203. Short-term structure broke; the long-term trend held. The disciplined read is that this is a pullback until the 200-day lines break — QQQ’s 675 and NVDA’s 203 are the levels that would turn a wobble into a correction. Reclaiming the fast averages (QQQ 727, NVDA 223) would signal the leaders are back.
What should traders watch the week of October 19, 2026?
Earnings season deepens into a nervous tape. Regional bank earnings continue and are the most important read of the week — each report is now a referendum on whether the credit scare is isolated or a pattern. Mega-cap tech earnings begin to roll in, forcing the AI leaders to defend their valuations into broken short-term charts. Weekly jobless claims land Thursday, and it is the Fed’s last window of public speakers before its pre-meeting blackout ahead of the October 28–29 decision. Key levels to mark: SPY 771 resistance over 726 support, QQQ 727 over the critical 675, KRE 73 over 68, and NVDA 223 over 203. Watch whether the VIX holds above 20 into the weekend — fear that sticks is different from fear that fades.
Meta Trading Club provides educational content only. Nothing here is financial, investment, or trading advice, or a recommendation to buy or sell any security. Trading involves substantial risk of loss. Past performance does not guarantee future results. Market data as of the close Friday, October 16, 2026; index levels via major data providers, yields via the US Treasury daily par yield curve, charts by Finviz.