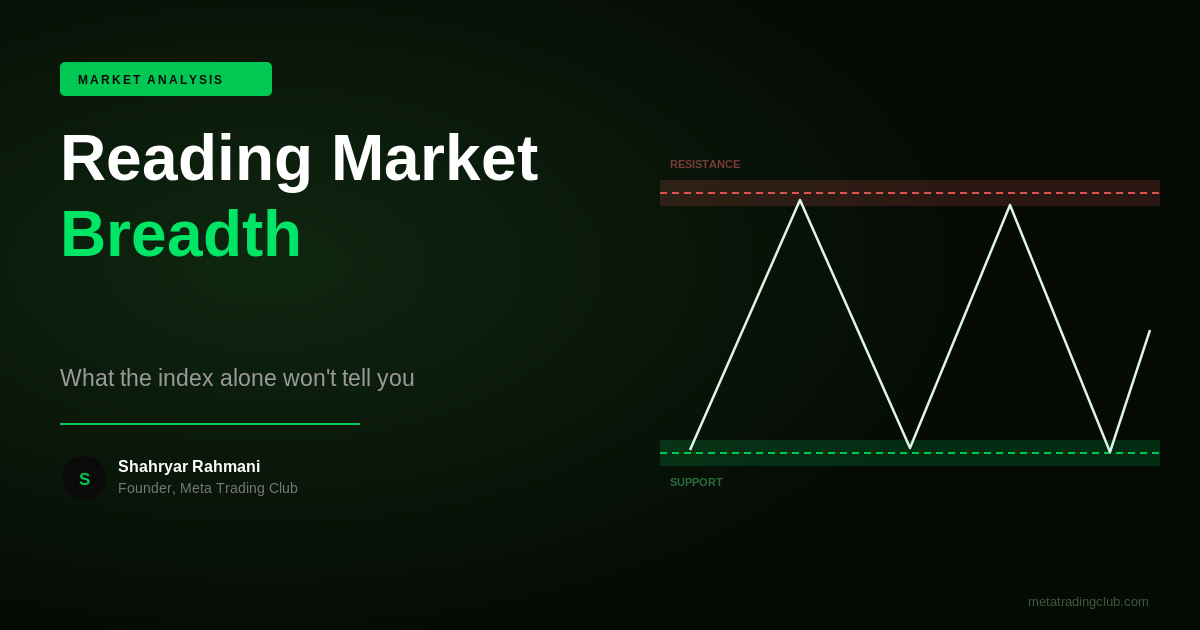
The index can lie. A handful of giant stocks can drag an index higher while most of the market quietly falls — and a trader watching only the index would never know the rally was hollow.
Market breadth is how you see underneath the surface. It measures how many stocks are actually participating in a move, separating a broad, healthy trend from a narrow, fragile one. For traders, it’s context that the headline number can’t give you.
Why breadth matters
Price tells you where the index is. Breadth tells you how many soldiers are behind the general. A rally led by a few names is built on thinner ice than it looks.
What Market Breadth Measures
Breadth looks at participation: how many stocks are rising versus falling, how many are making new highs versus new lows, how many sit above key moving averages. When most stocks move with the index, the trend is broad and healthier. When few do, the move is narrow and more vulnerable to reversal.
MTC Analysis
Two Identical Index Days, Very Different Internals
Two days the index closes green. On the healthy day most stocks rose; on the fragile day most fell and a few giants carried it. Same index print, opposite internal health.
When the Index and Breadth Disagree
The most useful signal is divergence. When the index makes a new high but breadth is shrinking — fewer stocks participating, fewer new highs — it’s a sign the move is being carried by a narrowing group. That doesn’t guarantee a reversal, but it tells you the trend is on thinner support than the headline suggests.
MTC Analysis
Broad Trend vs. Narrow Trend
Breadth turns one number into a read on the whole market’s health — context a single index price can’t provide.
Common Breadth Reads
You don’t need exotic tools. A few widely available measures give you most of the signal, and you’re mainly watching whether they confirm or diverge from price.
- Advancers vs. decliners — how many stocks rose versus fell
- New highs vs. new lows — expanding or contracting
- Percent of stocks above a key moving average
- Whether breadth confirms or diverges from the index
How Traders Use It
Breadth is context, not a trade trigger on its own. It informs your market bias — the first step of the MTC Alignment Engine. Strong, broad participation gives you more confidence to lean with a trend; narrowing breadth into new highs is a reason for extra caution, smaller size, or tighter management — not panic, just awareness.
Proprietary Framework
The MTC Alignment Engine™ — Applied Every Live Session
Every trade runs the same five checkpoints — consistency over gut reaction. Inside the MTC Incubator, members build their own system on top of this framework.
Frequently Asked Questions
What is market breadth?
Market breadth measures how many stocks are participating in a market move — advancers versus decliners, new highs versus new lows, or the percentage of stocks above a key moving average. It reveals whether a trend is broad and healthy or narrow and fragile.
Why can’t I just watch the index?
Because a few very large stocks can move an index on their own. The index can rise while most stocks fall, making a rally look stronger than it is. Breadth shows participation underneath the headline number, so you see whether the move is widely supported.
What is a breadth divergence?
A divergence is when price and breadth disagree — for example, the index makes a new high but fewer stocks are participating. It signals the move is being carried by a narrowing group and rests on thinner support, which raises caution even if it doesn’t guarantee a reversal.
What are common ways to measure breadth?
Widely used reads include advancers versus decliners, the number of new highs versus new lows, and the percentage of stocks trading above a key moving average. The main thing you’re watching is whether these confirm or diverge from the index’s price.
How do traders use market breadth?
Mostly as context for market bias rather than a standalone signal. Broad participation supports leaning with a trend; narrowing breadth into new highs argues for more caution and smaller size. It informs the bias step of a structured process like the MTC Alignment Engine.
Related reading
- Market Mornings (2024.06.13) Easing Inflation and Mixed Market Moves
- Market Mornings (2024.06.12) Inflation Data and Federal Reserve Decision Drive Market Sentiment
- Market Mornings (2024.06.11) Fed Decisions, Market Reactions
- Weekly Market Mornings ( 2024.06.09 ) Market Volatility Amid Central Bank Decisions and Strong US Jobs
Meta Trading Club Community
Start Your 7-Day Free Trial
Daily live sessions. Real-time market prep — not signals. The MTC Alignment Engine™ applied in front of you. Trade alongside Shahryar from day one.
Cancel anytime. No contracts. Built for Canadian traders.
Already trading and want to build your own system?
The MTC Incubator is an application-based mentorship — 1-on-1 work building a personalized system on the Alignment Engine™.