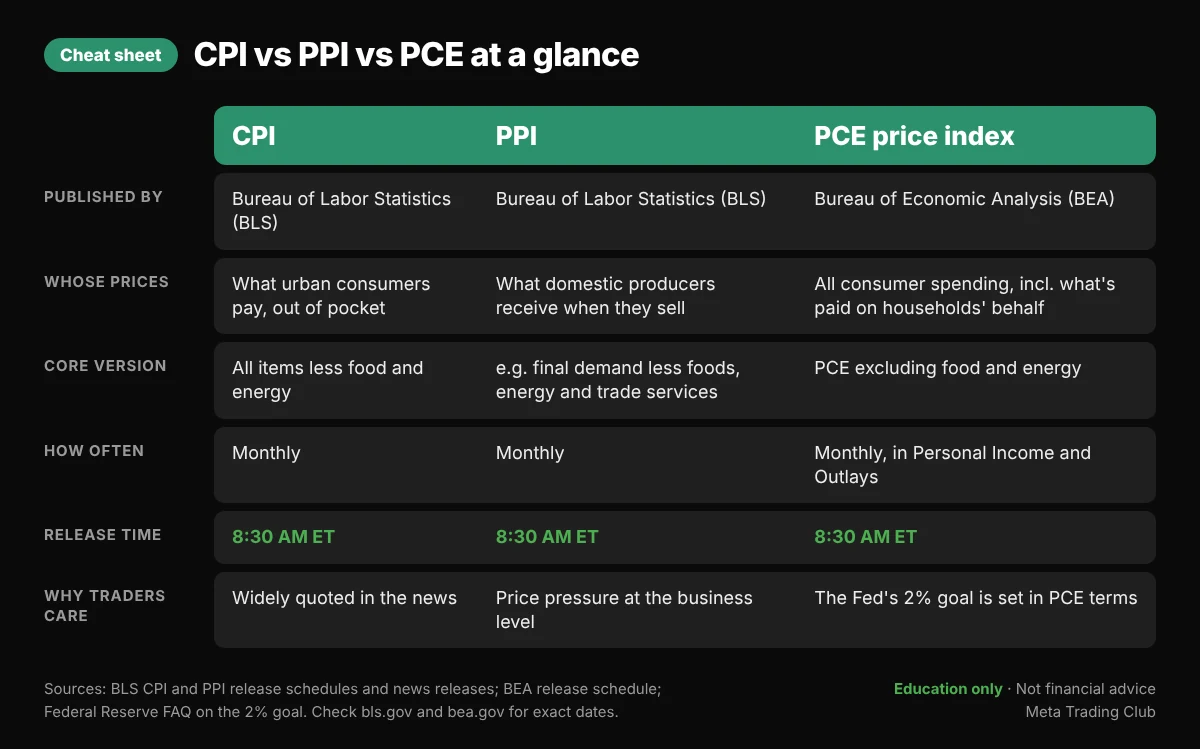
CPI measures the prices consumers pay. PPI measures the prices producers get paid. PCE measures prices across everything households consume, including what others pay on their behalf, and it is the gauge behind the Fed’s 2% goal. All three are released at 8:30 AM ET. Markets react to the surprise versus forecasts, not just the number.
If you trade US stocks, these three reports show up on your calendar every month. This guide explains what each one measures, how they differ, when they come out, and why the same number can send yields, the dollar and tech stocks moving at once. Then we show how we at Meta Trading Club prepare for a release day without guessing the print.
What inflation is, and why the Fed cares
The Federal Reserve defines inflation as the rate at which the price of goods and services rises over time. Congress gave the Fed two main jobs, often called the dual mandate: maximum employment and stable prices.
Stable prices, in the Fed’s words, means inflation of 2% over the longer run, measured by the annual change in the PCE price index. That is why inflation reports matter so much to traders. Each one changes what the market thinks the Fed will do with rates. Our guide to trading a Fed decision covers the meeting itself; this page covers the data that feeds it.
CPI: the Consumer Price Index
The Consumer Price Index, published monthly by the Bureau of Labor Statistics (BLS), measures the average change over time in the prices paid by consumers for a basket of goods and services. The headline version, CPI-U, covers urban consumers, a group that makes up over 90% of the US population.
The BLS release gives two main numbers. The monthly change is seasonally adjusted. The 12-month change, the one you see in headlines, is not seasonally adjusted. When people say “CPI came in at” a number, ask which one they mean.
CPI is released at 8:30 AM Eastern Time. It is the inflation number you will see quoted widely in the news.
Core inflation: headline vs core
Headline inflation includes everything. Core inflation strips out food and energy. The reason is simple: food and energy prices can swing hard from month to month because of seasons and volatile markets, which hides the underlying trend.
- Core CPI is the CPI for “all items less food and energy.”
- Core PCE is the PCE price index excluding food and energy.
- Core PPI is less standard. BLS publishes several narrower PPI indexes, such as final demand less foods, energy, and trade services.
The St. Louis Fed’s FRED Blog notes that the FOMC primarily focuses on core PCE inflation. The 2% goal itself, per the Fed, is set on the headline PCE index. That is why, on release day, we always read core right next to headline.
PPI: the Producer Price Index
The Producer Price Index, also from BLS, measures the average change over time in the selling prices received by domestic producers for their output. Think of it as inflation from the seller’s side of the counter, while CPI is the buyer’s side.
The headline is the PPI for final demand. It tracks prices for goods, services and construction sold for personal consumption, capital investment, government and export. Because PPI uses producer selling prices, it leaves out sales and excise taxes, which CPI includes.
Why do traders watch it? BLS notes that producer prices can be an early indicator of later price changes for businesses and consumers. Rising costs at the producer level can feed into what shoppers pay later, though not always one for one. PPI is also released at 8:30 AM ET.
PCE and core PCE: the Fed’s preferred gauge
The Personal Consumption Expenditures (PCE) price index is produced monthly by the Bureau of Economic Analysis (BEA). It comes out inside BEA’s Personal Income and Outlays report, scheduled for 8:30 AM ET. It has been the Fed’s preferred inflation measure since 2000.
PCE and CPI both measure consumer prices, but they are built differently:
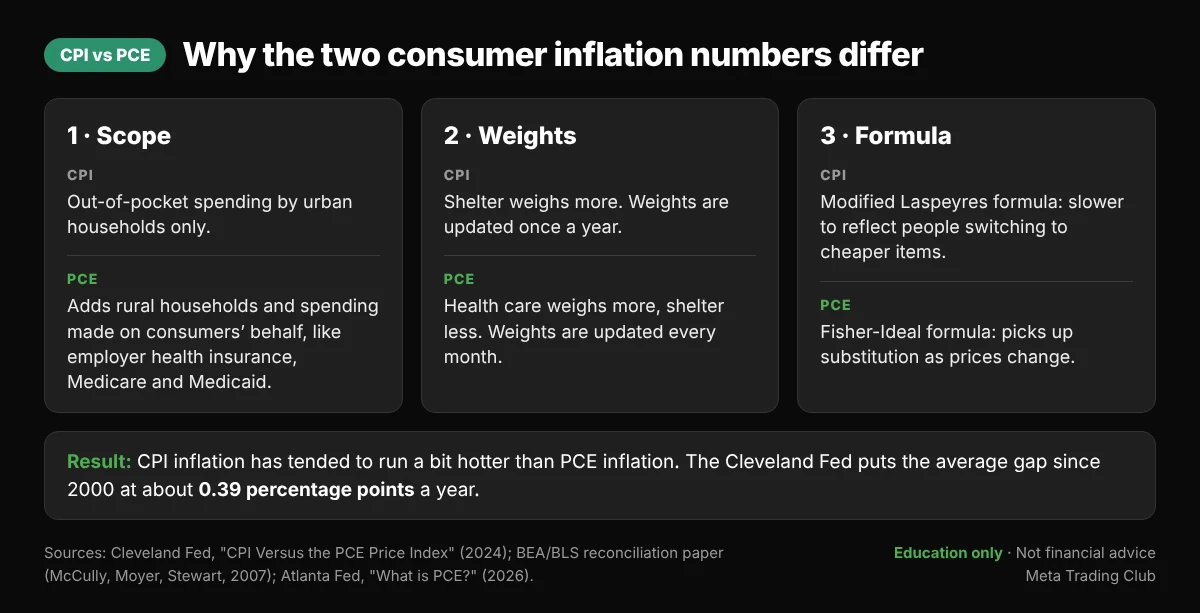
- Scope. CPI covers out-of-pocket spending by urban households. PCE adds rural households and spending made on consumers’ behalf, like employer-provided health insurance, Medicare and Medicaid.
- Weights. Shelter carries more weight in CPI, health care more in PCE. PCE updates its weights every month; CPI updates them once a year.
- Formula. CPI uses a modified Laspeyres formula. PCE uses a Fisher-Ideal formula, which better reflects people switching to cheaper items when prices rise.
The result: CPI inflation has tended to run a little hotter than PCE. The Cleveland Fed calculates that since 2000, annual CPI inflation has averaged about 0.39 percentage points above PCE inflation. So a CPI reading and a PCE reading for the same month are not directly comparable.
Personal income and spending: the rest of the PCE report
The same BEA release also reports personal income, disposable personal income (personal income minus personal current taxes) and personal consumption expenditures, which is consumer spending in dollars. BEA defines personal outlays as PCE plus personal interest payments and personal current transfer payments. So “the PCE report” gives you both the price index and a read on how much households earned and spent.
When CPI, PPI and PCE come out (ET)
All three reports are scheduled for 8:30 AM Eastern Time: CPI and PPI from BLS, PCE from BEA with Personal Income and Outlays. Dates shift every month, and government schedule changes can move them, so always check the official BLS and BEA calendars. Our Economic Calendar 101 shows how to build that habit into your week.
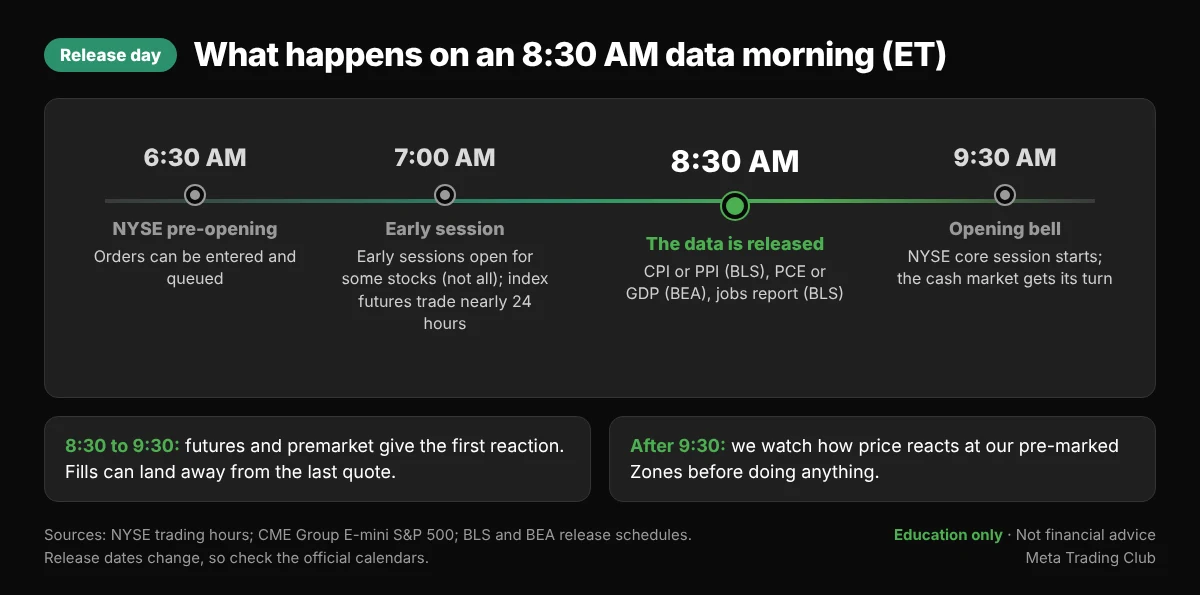
8:30 AM is an hour before the NYSE opening bell at 9:30 AM ET. But markets are not closed when the data hits. Some stocks can trade from 7:00 AM ET in NYSE early sessions (not every stock), and index futures trade nearly around the clock. So the first reaction happens in futures and premarket, before most people can trade the cash open.
We cover each morning’s scheduled releases in our premarket brief on the Stock Market Today hub, and how the day closed in the After Hours wrap.
Hot, cool or in line: what “vs consensus” means
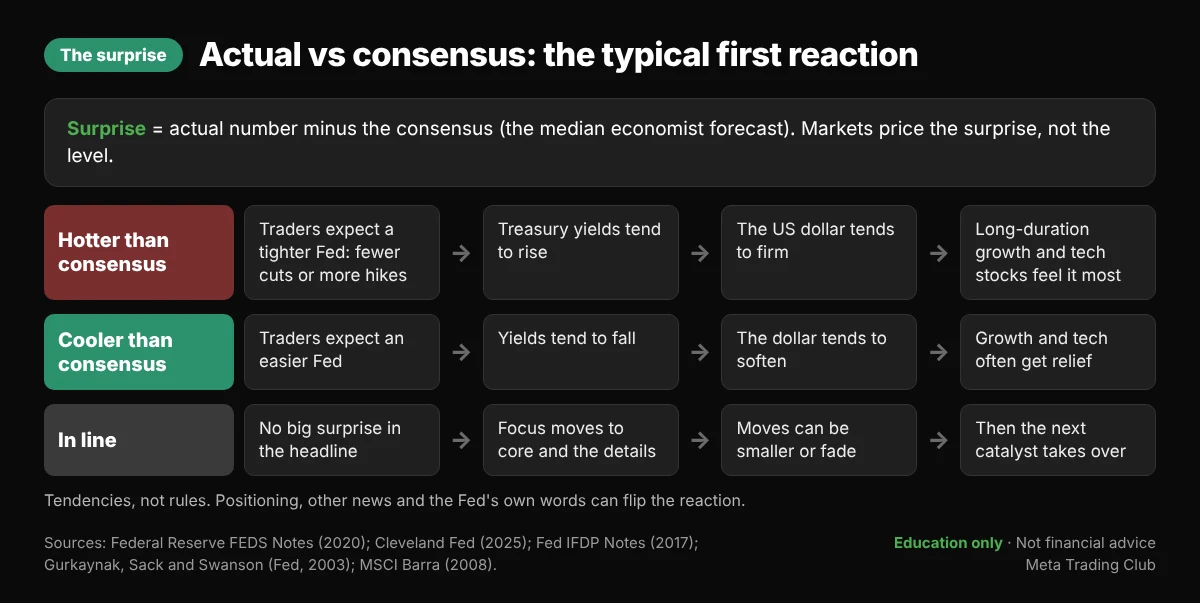
Before every release, economists publish forecasts. The consensus is the middle of those forecasts, usually the median. Fed researchers measure a data surprise as the actual number minus that median forecast.
- Hot means the number came in above consensus. For inflation, that is the “bad” surprise.
- Cool means below consensus.
- In line means close to consensus. Then the details (core, revisions, components) matter more.
This is the key idea most new traders miss. Markets price in the forecast ahead of time, so the reaction comes mostly from the gap between actual and expected, not from whether the number is “high” or “low.” A 2003 study by Andersen, Bollerslev, Diebold and Vega found that in currency markets these surprises cause quick price jumps right at release time, and that bad news tends to hit harder than good news there.
Why yields, the dollar and tech stocks react
It all runs through one question: what will the Fed do with rates?
- Treasury yields. A hot inflation surprise makes traders expect a tighter Fed, so yields tend to rise. Fed economists have shown that even long-term rates often react strongly to data surprises.
- The 2-year yield. Cleveland Fed research notes it tends to rise and fall with the fed funds rate, and found it became much more sensitive to core CPI surprises in 2022 to 2024 than before the pandemic.
- The US dollar. When expected US rates rise unexpectedly, the dollar tends to strengthen. A Federal Reserve note found the dollar rose against most currencies after surprise increases in expected policy rates, though other factors often dominate.
- Tech and growth stocks. Analysts value stocks by discounting future cash flows, often using long-term yields as the base. Growth companies have more of their value far in the future, so higher yields tend to hit them harder. MSCI research found US growth stocks had a longer “duration” than value stocks, and Nasdaq research makes the same point about growth valuations.
- The broad market. A 2020 Fed study found that, across the weeks between FOMC meetings, inflation surprises were linked to lower S&P 500 returns on average, while stronger-than-expected activity data lined up with higher returns. Activity news explained more of the moves than price news.
The jobs report (nonfarm payrolls)
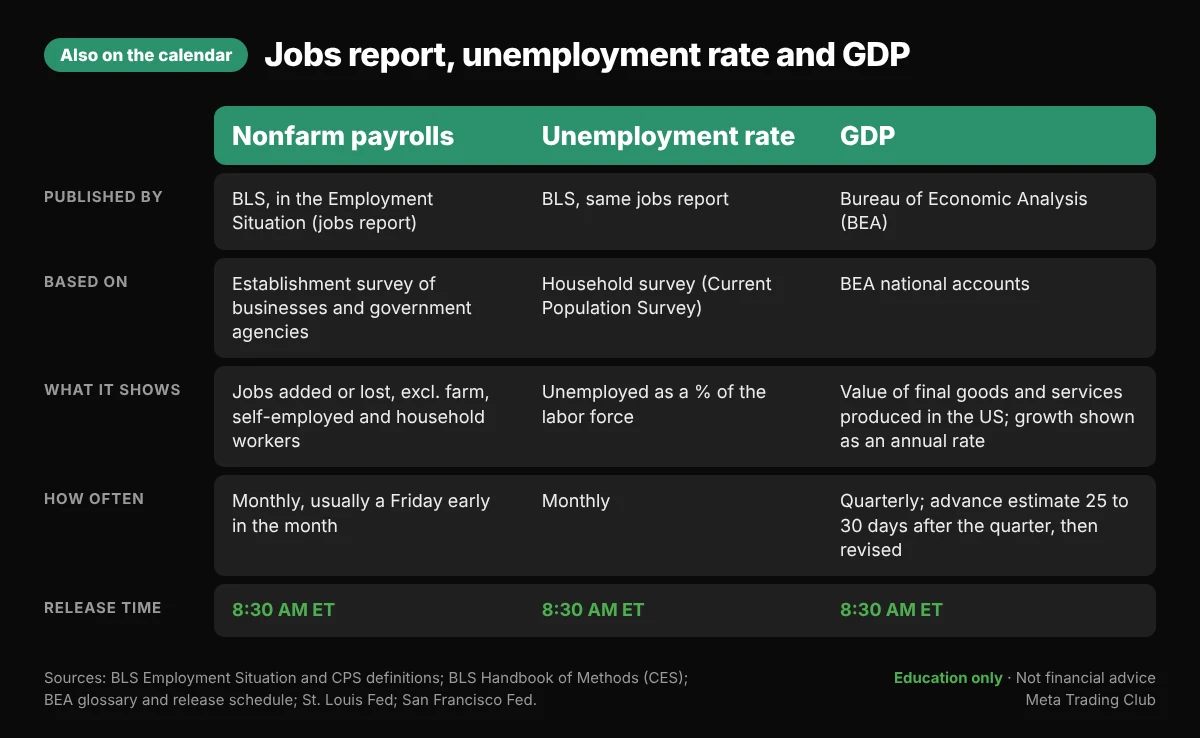
Inflation is half of the Fed’s mandate. Jobs are the other half. The BLS Employment Situation, better known as the jobs report, is released at 8:30 AM ET, usually on a Friday early in the month.
The headline number, nonfarm payrolls (NFP), comes from the establishment survey of businesses and government agencies. It counts jobs added or lost and leaves out farm workers, the unincorporated self-employed, private household workers and unpaid volunteers.
The unemployment rate
The unemployment rate comes from a different survey in the same report: the household survey, also called the Current Population Survey. It is the number of unemployed people as a percentage of the labor force. To count as unemployed, a person must have had no job during the survey week, been available to work, and made at least one active effort to find a job in the past four weeks.
Because they come from two different surveys, payrolls and the unemployment rate can point in different directions in the same month. Read both.
GDP: gross domestic product
GDP, published by BEA, measures the value of final goods and services produced in the United States. It is quarterly. The advance estimate comes 25 to 30 days after the quarter ends, followed by a second and third estimate as more data comes in. BEA reports growth as an annual rate and releases it at 8:30 AM ET. Because early estimates use incomplete data, revisions are normal.
How we prepare for a data release at MTC
We at Meta Trading Club treat release mornings as a different kind of day. We don’t try to guess the number. We plan for the reaction, using the same five steps of our Alignment Engine:
- Bias. Know which report is out, the time, and the consensus for headline and core. Note the trend going in.
- Zone. Mark your Zones before 8:30 AM. Zones are areas, not single lines. Don’t draw new ones in the middle of a spike.
- Reaction. Let the first move happen. Watch how price behaves when it reaches a Zone, in futures or premarket and again after the 9:30 open.
- Confirmation. Wait for the candle and structure to confirm the reaction. No confirmation, no trade.
- Execution. Use smaller size on release days. Prices can move fast, and fills can land away from the last quote. Know your stop before you enter.
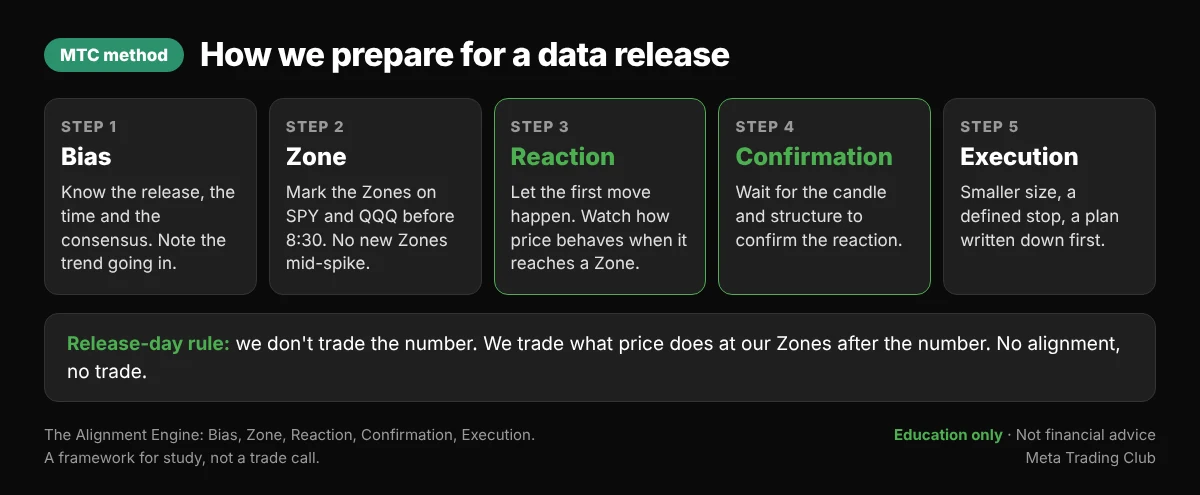
A release that lands in line can still make for a quiet, choppy session. A big surprise can trend all day. Your job is not to predict which. It is to have Zones ready and to let price show you. No alignment, no trade.
Common mistakes on inflation days
- Trading the first second. The first move can reverse. Wait for the reaction at a Zone.
- Ignoring the consensus. A “high” number that matches the forecast is not a surprise.
- Watching only the headline. Core and the month-over-month change often matter more.
- Mixing up CPI and PCE. They are built differently, so their numbers don’t compare one to one.
- Using market orders in a fast market. The SEC notes a market order can fill at a price different from the last trade. Limit orders give price control, but may not fill.
- Forgetting revisions. GDP, payrolls and other data get revised. One print is never the full story.
Frequently asked questions
Sources (checked October 31, 2026)
Primary: BLS
- BLS: Consumer Price Index questions and answers
- BLS: CPI news release, January 2026 (released Feb 13, 2026)
- BLS: CPI release schedule
- BLS: Producer Price Indexes home
- BLS: What is the PPI?
- BLS Monthly Labor Review: Comparing final demand PPIs with other price indexes (2014)
- BLS: PPI news release, August 2026 (released Sep 10, 2026)
- BLS: PPI release schedule
- BLS research paper: A comparison of PCE and CPI (Johnson, 2017)
- BLS: The Employment Situation (jobs report)
- BLS: Employment Situation release schedule
- BLS: CES news release schedule
- BLS: Current Population Survey definitions
- BLS Handbook of Methods: Current Employment Statistics concepts
Primary: BEA
- BEA: Personal Income and Outlays, December 2025
- BEA: Release schedule
- BEA: GDP (Advance Estimate), 2nd Quarter 2026
- BEA glossary: Gross domestic product
- BEA glossary: Advance estimate
- BEA glossary: Third estimate
- BEA/BLS: A reconciliation between the CPI and the PCE price index (2007)
Primary: Federal Reserve
- Federal Reserve: Why does the Fed aim for 2 percent inflation?
- Federal Reserve: What economic goals does the Fed seek to achieve?
- Federal Reserve: Economy at a glance, inflation (PCE)
- FEDS Notes: Macroeconomic news and stock prices over the FOMC cycle (2020)
- IFDP Notes: The sensitivity of the US dollar to monetary policy expectations (2017)
- FEDS: The excess sensitivity of long-term interest rates (Gurkaynak, Sack, Swanson, 2003)
- Cleveland Fed: Infographic, the CPI versus the PCE price index (2024)
- Cleveland Fed: Markets expected the Fed to react more to inflation surprises (2025)
- Cleveland Fed: Why does the Fed care about inflation?
- Atlanta Fed: What is PCE? Explaining the Fed’s preferred inflation measure (2026)
- Atlanta Fed: Labor Report First Look
- St. Louis Fed, FRED Blog: Why exclude food and energy from inflation measures? (2026)
- St. Louis Fed: Nonfarm payrolls, why farmers aren’t included (2019)
- San Francisco Fed, Dr. Econ: How GDP is defined, calculated and released (2005)
Markets and other references
- NYSE: Trading hours
- CME Group: E-mini S&P 500 futures
- SEC Investor.gov: Understanding order types
- LPL Financial: Market, price and volume volatility disclosure
- Andersen, Bollerslev, Diebold, Vega: Micro effects of macro announcements (2003)
- MSCI Barra: Value-growth dynamics in interest rate cycles (2008)
- Nasdaq: What to (and not to) fear when the Fed tightens (2021)
- USAFacts: How the government gathers the monthly jobs report
Education only. Not financial advice. Release dates and times can change; confirm on bls.gov and bea.gov.