Thursday, September 10, 2026 · 4:30 PM ET · MTC Market Close
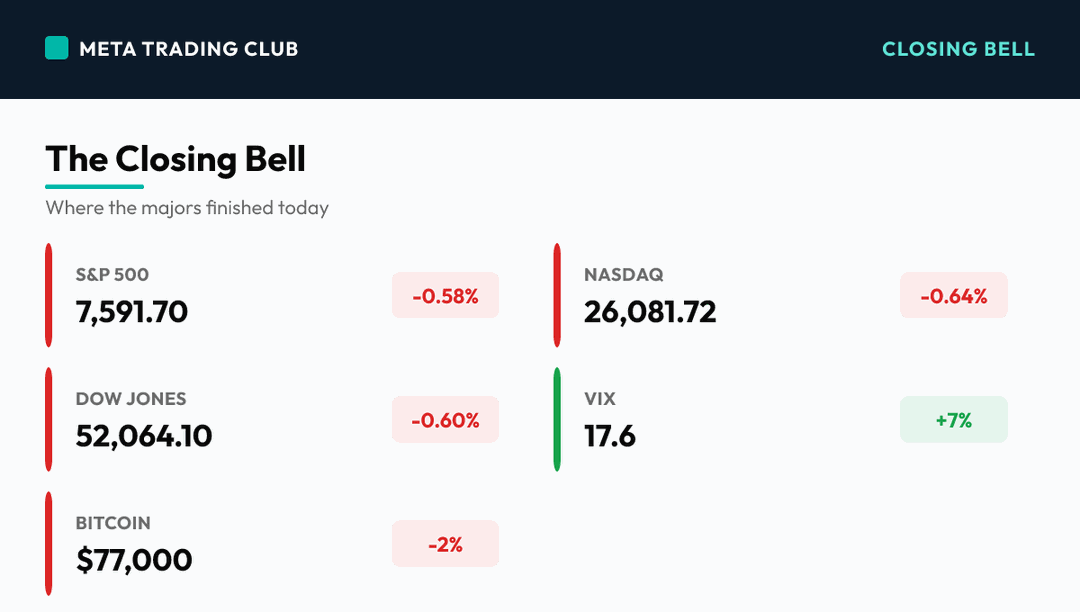
The stock market today delivered a simple lesson: the inflation print behaved and the market fell anyway — that is the whole story of the fourth straight down day. August PPI rose 0.4% for the month, exactly in line, but the year-over-year rate climbed to 5.4% from 4.8%, and the tape looked straight past the in-line headline to the two things that are actually driving it: oil and yields. WTI closed above $102 (up roughly 6.7%) and Brent cleared $105 as the U.S.-Iran conflict pushed into its seventh month, while the 10-year Treasury yield hit 4.954% — a fresh 52-week high, with the entire curve at new highs. The S&P 500 lost 0.58% to 7,591.70, slipping below the 7,600 shelf that yesterday’s wrap flagged as the line in the sand; the Nasdaq fell 0.64% to 26,081.72 and the Dow shed 316 points (0.60%) to 52,064.10. The Russell 2000 was worst again, off about 1.1%, as higher-for-longer repriced small caps for a third straight session. CME odds of a rate HIKE at next week’s FOMC climbed to nearly 70%. Energy was the only real bid; semis and materials led the losses. Oracle and Adobe reported after the bell into an unforgiving tape. The read into Friday’s CPI is simple: 7,600 is now resistance to reclaim, and the inflation print is the referee.
The Closing Bell
| Instrument | Close | Change | Note |
|---|---|---|---|
| S&P 500 | 7,591.70 | -0.58% | A fourth straight decline, and the one that matters technically: price closed at 7,591.70, slipping just below the 7,600 shelf that had held as support. What was the floor is now the ceiling to reclaim, and it broke on a day the inflation data actually cooperated. |
| Nasdaq | 26,081.72 | -0.64% | The Nasdaq Composite lost 0.64% to 26,081.72, led lower by a hard semiconductor selloff as rising long-end yields hit the highest-multiple names first. Intel fell 5.7% on profit-taking after a multi-session rally. |
| Dow Jones | 52,064.10 | -0.60% | The Dow shed 316 points (0.60%) to 52,064.10, its rate-sensitive and cyclical names weighed down as the 10-year printed a new 52-week high across the entire curve. |
| Russell 2000 | — | -1.1% | Small caps were the worst major index for a third straight session, off roughly 1.1%, with heavy red in cyclicals, industrials, real estate, and materials. Higher-for-longer is a direct tax on the most rate-sensitive corner of the market. |
| VIX | 17.6 | +7% | Fear ticked up toward the high-17s, up around 7%, but the level is still contained. This is a market repricing a known risk — rates and oil — not one fleeing an unknown shock. Anxiety, not panic. |
| 10-Year Yield | 4.954% | +11 bps | The engine of the entire selloff: the 10-year hit 4.954%, a fresh 52-week high, with 2s through 30s all setting new highs. When the risk-free rate keeps climbing, every valuation resets lower — this is the number underneath the tape. |
| WTI Crude | $102.48 | +6.7% | WTI closed above $102 (up about 6.7%) and Brent cleared $105, the highest since spring, as the U.S.-Iran conflict entered its seventh month and Strait of Hormuz supply risk stayed priced in. Oil is hard-wiring an inflation premium straight into the Fed’s window. |
| Gold | $4,326 | -1.7% | Gold fell about 1.7% to roughly $4,326, notably NOT catching a safe-haven bid on a red equity day. When gold sells with stocks, the message is that rising real yields are pulling money out of everything that does not pay a coupon. |
| Bitcoin | $77,000 | -2% | Bitcoin slipped toward $77K, breaking below $80,000 as the higher-rate repricing drained risk appetite. Like gold, crypto offered no shelter today — the tell that this is a liquidity-and-rates move, not a growth scare. |
Today’s Charts
Daily candlestick charts with 20/50/200-day moving averages — the index majors, the day’s biggest mover on each side, and the leading sector ETF.

Charts: Finviz (daily). Levels and overlays update through the next session.
Sector Scoreboard

What Drove The Day
Thursday was the cleanest illustration yet of what is actually driving this market. The morning’s PPI came in exactly as expected at 0.4% for the month — the kind of in-line print that, in a normal tape, buys stocks a relief bounce. Instead the S&P sold off to a fourth straight lower close, because the market is no longer trading the inflation headline; it is trading the two forces underneath it. First, oil. WTI closed above $102 and Brent cleared $105 as the U.S.-Iran war pushed into a seventh month, keeping a supply-risk premium bolted onto every forward inflation estimate. Second, rates. The 10-year yield hit 4.954%, a fresh 52-week high, and every tenor from the 2-year to the 30-year set new highs with it. The two feed each other — hot oil lifts inflation expectations, inflation expectations lift yields, and higher yields compress every multiple in the market. That loop is why the tape bled on good news: the annual PPI rate actually rose to 5.4% from 4.8%, and CME odds of a September rate HIKE climbed to nearly 70%. Beneath the surface, breadth confirmed it — only about a third of issues advanced. Semiconductors led the losses as the longest-duration growth names reset (Intel -5.7%), materials cratered on a copper reversal (Freeport -7.3%, Southern Copper -7.1%), and the standout single-name blowup was Cooper Companies, down roughly 14% on a slashed outlook. Energy was the only sector with real conviction. The close, 7,591.70, sits just under the 7,600 shelf yesterday’s wrap called the line in the sand — and today, quietly, it gave way. After the bell, Oracle and Adobe reported into a stressed tape, setting up the overnight. Everything now points at Friday’s CPI.
MAJOR HEADLINES AND CATALYSTS
Top Market-Moving Stories
- FOURTH STRAIGHT DOWN DAY ON GOOD INFLATION NEWS (Day) – The S&P 500 fell 0.58% to 7,591.70, the Nasdaq lost 0.64%, and the Dow shed 316 points (0.60%). The significance is not the size but the setup: PPI came in exactly in line, and the market fell anyway. When stocks cannot rally on good news, the driver is something the data does not control — here, oil and yields.
- PPI IN LINE AT 0.4%, BUT THE ANNUAL RATE ROSE TO 5.4% (Day) – August wholesale inflation matched the 0.4% monthly consensus, but it followed an upwardly revised July and pushed the year-over-year rate to 5.4% from 4.8%, slightly above forecasts. The monthly relief was cosmetic; the trend underneath is still accelerating, and the market read it that way.
- OIL SHOCK: WTI CLOSES ABOVE $102, BRENT OVER $105 (Day) – WTI surged roughly 6.7% to close above $102 and Brent cleared $105, the highest since spring, as the U.S.-Iran conflict entered its seventh month. President Trump said prices likely will not fall until after the midterms. Persistent triple-digit oil hard-wires an inflation premium straight into next week’s FOMC.
- 10-YEAR HITS 4.954% — FRESH 52-WEEK HIGH ACROSS THE CURVE (Day) – Treasury yields set new 52-week highs from the 2-year to the 30-year, with the 10-year at 4.954% (+11 bps). This is the number beneath the selloff: a rising risk-free rate resets every valuation lower, and it is why the tape bled on a benign inflation print rather than rallying.
- FED HIKE ODDS NEAR 70% INTO A LIVE MEETING – CME FedWatch odds of a 25 bp HIKE at the September 15-16 FOMC climbed to nearly 70% as oil and yields did the talking. New Fed Chair Kevin Warsh has never promised a hike; the market is, in effect, daring him to deliver one — and Friday’s CPI is the referee.
- SINGLE-NAME DAMAGE: COOPER -14%, FREEPORT -7.3%, INTEL -5.7% (Day) – Cooper Companies tumbled about 14% on a disappointing strategic review and slashed guidance; Freeport-McMoRan fell 7.3% and Southern Copper 7.1% as copper reversed from record highs; Intel dropped 5.7% in a broad semiconductor selloff. The pain was concentrated in materials and chips — the two groups most exposed to the rate-and-commodity whipsaw.
AFTER-HOURS EARNINGS SPOTLIGHT
Oracle and Adobe Report Into a Stressed Tape
- The marquee post-close event: Oracle (ORCL) and Adobe (ADBE) both reported after the bell. Oracle closed down about 4% into the print at roughly $155, with options implying a move near 10-11% — the Street modeled about $19.13 billion in revenue and the market was fixated on cloud order growth (guided 58-64%) and whether the company’s massive AI-infrastructure capex will convert to realized revenue against a $638 billion remaining-performance-obligation backlog.
- Adobe (ADBE) reported alongside it, with consensus near $5.84 EPS on $6.70 billion in revenue. Both names carry large implied moves into a tape already stressed by rates and oil — a soft cloud read or a cautious AI-capex tone from either would land hard. Exact after-hours price reactions were still developing at the 4:30 PM ET close and were not confirmed in the closing-window data (N/A); the overnight setup hinges on them.
Winners & Losers

Winners
| RDDT | +4.70% | Reddit was among the day’s cleanest winners (Day), up 4.7% after Piper Sandler data showed an 8% month-over-month jump in the platform’s user base in August. On a red tape driven by rates, the market still paid up for a clear user-growth story. | |
| CHTR | +4.50% | Charter Communications jumped 4.5% (Day) on a technical rebound and a positive reaction to management’s growth plans after a sharp prior-session selloff. A bounce-back name, not a trend leader — but green on a broadly red day. | |
| ELV | +4.10% | Elevance Health rose 4.1% (Day) after saying it will reaffirm its full-year 2026 earnings and benefit-expense guidance. Defensive managed care caught the rotation bid as money left high-multiple growth for steadier ground. |
Losers
| COO | -14.00% | Cooper Companies tumbled roughly 14% (Day), the day’s biggest S&P blowup, on a disappointing strategic review, slashed financial guidance, a revenue miss, and a wave of analyst downgrades. A textbook idiosyncratic reset — when the story breaks, the multiple goes with it. | |
| FCX | -7.30% | Freeport-McMoRan sank 7.3% (Day) as copper retreated hard from record highs, dragging the whole materials complex. The reflation-and-metals trade unwound on the same session yields spiked — a double hit for the miners. | |
| INTC | -5.70% | Intel fell 5.7% (Day) on profit-taking after a multi-session rally, leading a broad semiconductor selloff driven by rising 10-year yields and surging oil. The longest-duration growth names reprice first and hardest when the risk-free rate makes a new high. |
What It Sets Up For Tomorrow
Levels Into Tomorrow
- S&P 500 7,600 – THE SHELF THAT BROKE. Price closed at 7,591.70, just below the 7,600 level that had held as support through this pullback. The character has flipped: 7,600 is now the first ceiling to reclaim, not the floor to defend. A decisive close back above it — ideally on a soft CPI that cools the hike fear — repairs the near-term damage. Fail to reclaim, and every bounce is a rally into supply.
- S&P 500 7,550 – THE FIRST FLOOR BELOW. With 7,600 lost, 7,550 is the next real support and the level dip-buyers get to defend on a hot CPI. Hold it and the pullback stays orderly, a controlled four-day reset. Lose it on a closing basis and the next shelf at 7,500 comes squarely into play into the September 15-16 Fed.
- S&P 500 7,500 – THE DOWNSIDE OBJECTIVE. If CPI runs hot on Friday, the 10-year pushes past 5.00%, and 7,550 gives way, 7,500 is the bear’s target into the FOMC. This is the level in play if the higher-for-longer, maybe-a-hike fear the tape is pricing gets confirmed on the inflation data.
Bull case: Friday’s CPI comes in soft — core at the expected 0.2% or lower — and the September-hike debate cools fast. The 10-year backs off 4.95%, oil stabilizes with no fresh Strait of Hormuz escalation, and the S&P reclaims 7,600 on a closing basis. The safe-haven names that sold today (gold, bonds) find footing, the semiconductor de-rating pauses, and the four-day bleed is revealed as an orderly reset ahead of a Fed that, with in-line data, can comfortably hold. Energy’s bid fades in the good way — crude eases, the inflation premium deflates, and the rate-sensitive groups that led the tape lower catch a relief bounce back toward 7,700.
Bear case: CPI runs hot — core prints 0.3% or higher — and it confirms what PPI’s 5.4% annual rate hinted at. The 10-year breaks above 5.00%, the market moves a September hike from probable toward near-certain, and oil stays bid or gaps higher on a fresh tanker headline. 7,600 stays resistance, 7,550 gives way, and 7,500 and the range below come into play. A controlled four-day grind becomes a directional flush into a Fed that cannot talk the market down until it decides, with a new chair the tape is openly daring to hike.
Risks Into Tomorrow
- When the market falls on good news, listen to what it is telling you — PPI came in exactly in line, and stocks sold off to a fourth straight lower close anyway. That is the single most important signal of the day. A market that cannot rally on benign data is a market whose problem lives outside the data — here, oil above $102 and a 10-year at a fresh 52-week high. The inflation headline is the distraction; the rate-and-commodity loop underneath is the trade. Until that loop breaks, every bounce is being sold into rather than chased, and good news keeps landing as a shrug.
- Higher yields are the tide, and today even the havens went out with it — The 10-year at 4.954% is the number underneath everything. What made today distinct is that gold fell 1.7% and Bitcoin broke below $80,000 on the same red equity day — the classic safe havens offered no shelter. When rising real yields pull money out of stocks AND gold AND crypto simultaneously, it is not a growth scare or a fear trade; it is a liquidity-and-rates repricing where the discount rate on every asset is climbing at once. That is a rates market, not a stock-picker’s market, and Friday’s CPI is the next input that decides whether the tide keeps rising.
Frequently Asked Questions
How did the S&P 500 close today?
On Thursday, September 10, 2026, the S&P 500 closed at 7,591.70 (-0.58%), with the VIX at 17.6. The stock market today delivered a simple lesson: the inflation print behaved and the market fell anyway — that is the whole story of the fourth straight down day.
What drove the market today?
FOURTH STRAIGHT DOWN DAY ON GOOD INFLATION NEWS (Day) – The S&P 500 fell 0.58% to 7,591.70, the Nasdaq lost 0.64%, and the Dow shed 316 points (0.60%). The significance is not the size but the setup: PPI came in exactly in line, and the market fell anyway. When stocks cannot rally on good news, the driver is something the data does not control — here, oil and yields.
What levels matter for tomorrow?
S&P 500 7,600 – THE SHELF THAT BROKE. Price closed at 7,591.70, just below the 7,600 level that had held as support through this pullback. The character has flipped: 7,600 is now the first ceiling to reclaim, not the floor to defend. A decisive close back above it — ideally on a soft CPI that cools the hike fear — repairs the near-term damage. Fail to reclaim, and every bounce is a rally into supply. S&P 500 7,550 – THE FIRST FLOOR BELOW. With 7,600 lost, 7,550 is the next real support and the level dip-buyers get to defend on a hot CPI. Hold it and the pullback stays orderly, a controlled four-day reset. Lose it on a closing basis and the next shelf at 7,500 comes squarely into play into the September 15-16 Fed. S&P 500 7,500 – THE DOWNSIDE OBJECTIVE. If CPI runs hot on Friday, the 10-year pushes past 5.00%, and 7,550 gives way, 7,500 is the bear’s target into the FOMC. This is the level in play if the higher-for-longer, maybe-a-hike fear the tape is pricing gets confirmed on the inflation data.
How does Meta Trading Club prepare for the next session?
We wrap every session and carry the read forward through the MTC Alignment Engine — bias, level, reaction, confirmation, execution, targets. No alignment, no trade. Learn the full process inside the MTC Incubator.
New to this? Start with the free training.
Learn how we read the market before you risk a dollar — our free education library and ebook break down the fundamentals step by step.
Free education → Get the free ebookThe session’s over. The prep isn’t.
This is how MTC members close each day — wrap what happened, mark the levels, and carry one clean read into tomorrow. If you want to build that habit and qualify your own A+ setups instead of chasing alerts, the MTC Incubator is mentorship and a repeatable process. It’s application-based — see if it’s a fit.
Explore the MTC Incubator → Apply nowSources: Yahoo Finance, CNBC, TheStreet, Benzinga, Investing.com, Charles Schwab, and Babypips closing coverage for Thursday, September 10, 2026, including the S&P 500 close of 7,591.70 (-0.58%), Nasdaq 26,081.72 (-0.64%), Dow 52,064.10 (-0.60%, -316.56 pts), Russell 2000 off ~1.1%, the 10-year Treasury yield at 4.954% (fresh 52-week high across the curve), WTI above $102 (+6.7%) and Brent over $105 after the U.S.-Iran conflict entered its seventh month, August PPI at 0.4% monthly / 5.4% annual (up from 4.8%), CME odds of a 25 bp Fed hike near 70% into the September 15-16 FOMC, gold near $4,326 (-1.7%), Bitcoin below $80,000, and single-name moves in Reddit (+4.7%), Charter (+4.5%), Elevance (+4.1%), Cooper Companies (-14%), Freeport-McMoRan (-7.3%), Southern Copper (-7.1%), and Intel (-5.7%). Oracle and Adobe reported after the close. Tomorrow: CPI at 8:30 AM ET (Friday, Sept 11), consensus 0.4% monthly / 3.4% annual, core 0.2%.. For educational purposes only. Not financial advice.