The Sunday Setup · Week ending July 10, 2026 · ~6 min read
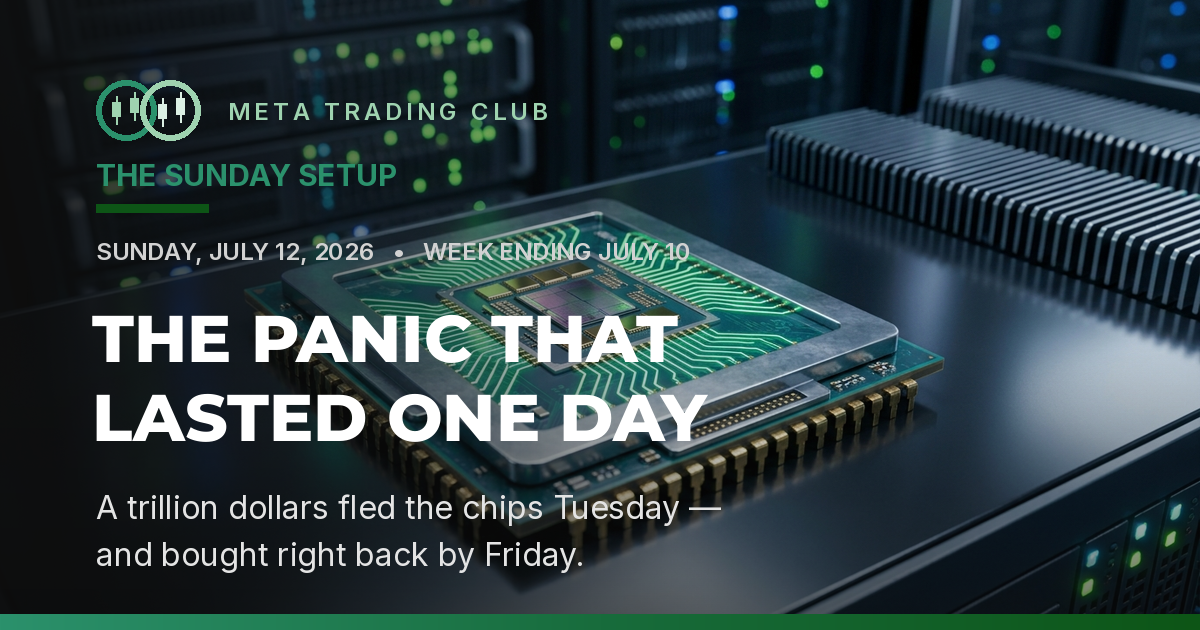
Tuesday looked like the top. A Samsung earnings miss cracked the AI story, the chips got flushed, and headlines put the number at more than a trillion dollars of semiconductor value wiped out in a single session. The “AI is a bubble” crowd took a victory lap.
Then the tape did something the panic didn’t expect. By Friday, the semis had rebuilt the entire move and closed the week green. Nasdaq led. Nvidia went out at a new high.
That’s the whole lesson in one week: fear that can’t hold a level isn’t a trend — it’s an entry for the other side. Here’s the promise for the next six minutes: we’ll break the week down the way we’d break down a single setup — bias, level, reaction — and by the end you’ll know exactly why our Chart of the Week was a textbook long, and what the panic sellers missed.
📊 The Scoreboard
A green week for the indices — but the number on the board hides a full round trip.
| Index | Close | Week |
|---|---|---|
| Nasdaq Composite ★ | 26,281.61 | ▲ +1.7% |
| S&P 500 | 7,575.39 | ▲ +1.2% |
| Dow Jones | 52,637.01 | ▼ −0.5% |
| Russell 2000 | 2,977.81 | ▼ −0.6% |
★ A complete role reversal from the prior week: this time big-cap tech led while the Dow and small caps lagged.

This was a round trip. The market got scared out of its leaders on Tuesday and bought every one of them back by Friday. Read the path, not just the finish line.

By Friday, the same AI names that got flushed were back on top for the week. Meta ran double digits; Broadcom, Nvidia and AMD followed. The laggards were the software mega-caps.

Where the money flowed tells the same story: energy led on a geopolitical oil spike, technology recovered to finish second, and the defensives — health care, staples, materials — got left behind.

🔍 Decoded: The Two That Actually Matter
1. The trillion-dollar scare that lasted one day
On Tuesday, Samsung’s earnings came in short of the market’s very high AI bar, and it lit the fuse on everything investors had been quietly worried about: dot-com-style valuations, whether all that AI capex ever earns a return, reports that SK Hynix might slow its high-bandwidth memory expansion. The chips got dumped — Micron −11%, Intel −9%, AMD −7% in a single session, over a trillion dollars of value gone. Then the buyers showed up. By Friday the semiconductor ETF (SMH) had recovered the whole drop and closed the week up roughly 3%.
Imbalance: the trade was crowded and priced for perfection — one bad print forced fast money out.
Positioning: the dip got bought aggressively, and leadership snapped back to the strongest names.
This is the trap in both directions. Shorting the panic on Tuesday because “the bubble finally popped” got you run over by Wednesday. The scare didn’t tell you what to do — the reaction to it did. And the reaction was: buyers defended the level.
2. Oil found a geopolitical bid
Crude jumped on the week — WTI ~+4% to about $71 and Brent ~+6% to about $76 — as renewed military exchanges between the U.S. and Iran put a fresh risk premium back into energy. The concern isn’t a barrel produced, it’s a barrel that can’t move: roughly a fifth of the world’s oil passes through the Strait of Hormuz, and any threat to that chokepoint gets priced instantly. Energy was the week’s best sector as a result.

Imbalance: headlines add a risk premium fast — and pull it back out just as fast if facilities stay untouched.
Positioning: energy names caught the bid, but geopolitical moves are two-way — you trade the level, not the news alert.
📈 Chart of the Week: NVDA Through the Engine
On Tuesday, the chip complex was a bloodbath — Micron down 11%, Intel down 9%, AMD down 7%. And Nvidia? It closed green. That single fact was worth more than any headline. When a stock refuses to break with its own group on the group’s worst day, the tape is showing you who’s strongest. It ended the week at $210.96, up 8.3% — a new high, on the heaviest volume of the week.

Here’s the sequence, run through the Alignment Engine:
1. Bias — relative strength flagged the leader. While the group flushed Tuesday, NVDA closed up. Relative strength on your group’s worst day is the cleanest bullish tell there is — it tells you where the money hides when it’s scared.
2. Key Level — it defended the shelf. The stock held the ~$192–195 area the rest of the sector lost, dipping to $191 intraday but closing back above. It kept the level the group couldn’t. The reaction happened at a level, not in mid-air.
3. Reaction — the hold became a push. Wednesday it broke back above $200 with a +3.7% day. That’s not just avoiding the selloff — that’s absorbing it and reversing.
4. Confirmation — Friday’s breakout, with the index aligned. It went out at $210.96, a fresh weekly high, +4% on the week’s heaviest volume — and the Nasdaq was climbing the same days. Price, volume and index all agreed.
5. Execution — the qualified long came on the reclaim, not the knife. No one had to catch Tuesday’s falling sector. The setup was to wait for the reclaim of $200 with the index aligned — then take it.
💬 What the Street Is Buzzing About
Tuesday’s flush split the timelines cleanly in two. One camp declared the AI bubble finally burst. The other called it the buy of the quarter. Both were screaming by lunchtime. Neither was a trade on its own.

🧊 “The AI bubble just popped.” The concern is fair — crowded, priced-for-perfection trades unwind fast. But “the top is in” is a prediction, not a level. And the level held. You don’t short a theme on a vibe; you wait for structure to break and stay broken. It didn’t.
🔥 “Buy of the quarter — same story, on sale.” Right conclusion, dangerous reasoning. “Cheaper than yesterday” is not a level, and catching Tuesday’s knife across the whole sector was a coin flip. The disciplined version wasn’t “buy the dip” — it was “buy the reclaim,” once a leader like NVDA proved demand.
🤝 Inside the Community
Every morning before the bell we run a live pre-market session — walk the indices, mark the levels, build the watchlist, then trade it live. In a violent, two-way week like this one, the room’s edge wasn’t calling the bottom. It was refusing to panic on Tuesday and having levels already marked when the reclaim came.
The teaching moment of the week came from a trade that won. A member took a reversal long and booked it — but in review, the coaching note flagged that he’d called it a break-and-retest when it was really a reversal off support. Two different setups, two different risk points. Why coach a winner? Because a right outcome from the wrong read is a habit that eventually pays you back with a loss. Name the setup correctly before you size it.
| Date | Ticker | Setup | Result |
|---|---|---|---|
| Jul 7 | INTC | Supply-zone breakdown, short (puts) | Win · runner |
| Jul 7 | NVDS | Chip-flush momentum scalp (intraday) | Win |
| Jul 8 | AAPL | Reclaim-and-retest, long (calls) | Win |
| Jul 9 | QQQ | Reversal at support, long (calls) | Win |
| Jul 9 | NVDA | Reversal long — mislabeled as break-and-retest | Win · flagged |
That last NVDA row is in the log on purpose. It won — and we still flagged it, because the setup was named wrong before it was sized. We review the process, not just the P&L. A green trade taken for the wrong reason is a lesson disguised as a paycheck.
👤 Member spotlight — the process refining in real time. One member worked the chip volatility from the short side, running a series of Marvell (MRVL) shorts as the sector flushed. The trades worked — but her own review was the standout: she caught herself scaling out too early on the ones that kept running, and spent the week deliberately refining where she takes partials versus where she lets a runner breathe. That’s the skill transferring — not the signal.
📅 The Week Ahead
Econ: the calendar wakes up. June CPI lands Tuesday — the key inflation read the Fed is watching as it weighs cuts against a softening labor market. PPI follows Wednesday, retail sales Thursday for a temperature check on the consumer, and the University of Michigan sentiment preliminary Friday.
Earnings: Q2 season kicks off in earnest with the big banks — JPMorgan and peers report around Tuesday. Financials set the tone for the whole season; watch the reaction, not just the numbers.

The watchlist — levels we’re marking
| Ticker | Resistance | Support |
|---|---|---|
| NVDA | 215 | 200 |
| SMH | 628 | 592 |
| QQQ | 737 | 707 |
| SPY | 758 | 745 |
The real question: was Tuesday’s flush a one-day scare or the first crack? If the AI leaders keep making higher lows and holding their reclaimed levels, the round trip stands. If they roll back under and stay under, the bears finally have a level. Watch the reaction, not the next red candle. Define your invalidation before the open.
Trade the level, not the panic.
Want to learn to qualify setups like the NVDA reclaim yourself? That’s what we do, live, every session inside the MTC Community. You watch the Engine run in real time, build the skill, and stop following — start deciding.
Frequently Asked Questions
Why did semiconductor stocks sell off on July 7, 2026?
A Samsung earnings miss on the market’s high AI-demand expectations triggered a sector-wide flush, with Micron down about 11%, Intel down 9% and AMD down 7% in a single session — more than a trillion dollars of semiconductor value on renewed worries about AI valuations and capex returns. The group recovered most of the drop by the end of the week.
Why did Nvidia hold up when the other chips fell?
Nvidia closed green on the day the rest of the sector was flushed, showing relative strength. It defended the ~$192–195 area, reclaimed $200 on Wednesday, and broke out to a weekly high of $210.96 on Friday — up 8.3% on the week on the heaviest volume, with the Nasdaq aligned to the upside.
Why did oil prices rise the week of July 10, 2026?
Crude gained on the week (WTI ~+4%, Brent ~+6%) as renewed U.S.–Iran military exchanges revived fears over supply security around the Strait of Hormuz, through which roughly a fifth of the world’s oil passes. Energy was the best-performing sector.
What is the Alignment Engine?
It’s Meta Trading Club’s framework for qualifying a trade before taking it: bias, key level, reaction, confirmation, execution. The rule is simple — no alignment, no trade. It’s designed to keep you from trading headlines and get you trading how price actually reacts at a level.
Meta Trading Club provides educational content only. Nothing here is financial, investment, or trading advice, or a recommendation to buy or sell any security. Trading involves substantial risk of loss. Past performance does not guarantee future results.