Open any charting platform and you’ll find dozens of indicators, each promising to be the edge you’ve been missing. So beginners stack them — moving averages, RSI, MACD, Bollinger Bands, stochastics — until the chart looks like a control panel and they’re more confused than when they started. This is backwards. The best traders use fewer indicators, not more, because indicators are tools for reading one thing: what price is doing. Pile on too many and they just contradict each other.
Here are the handful that actually earn their place on a beginner’s chart, and how to use them without drowning.
Less is more, genuinely
Beginners stack indicators until the chart is a control panel. The best traders use fewer — because indicators are tools for reading one thing: what price is doing.
First, the Most Important Indicator Isn’t an Indicator
Before any of these: price itself, and the structure it creates — higher highs and higher lows, support and resistance, trend. Every indicator below is derived from price and lags it. They confirm and contextualize what the chart is already telling you. If you can read structure, indicators add a little; if you can’t, no indicator will save you. Learn to read price first.
MTC Analysis
Four Tools, Four Questions
You don’t want five indicators saying the same thing. You want a few that, together, build a complete read — that alignment is confluence.
1. Moving Averages (Trend)
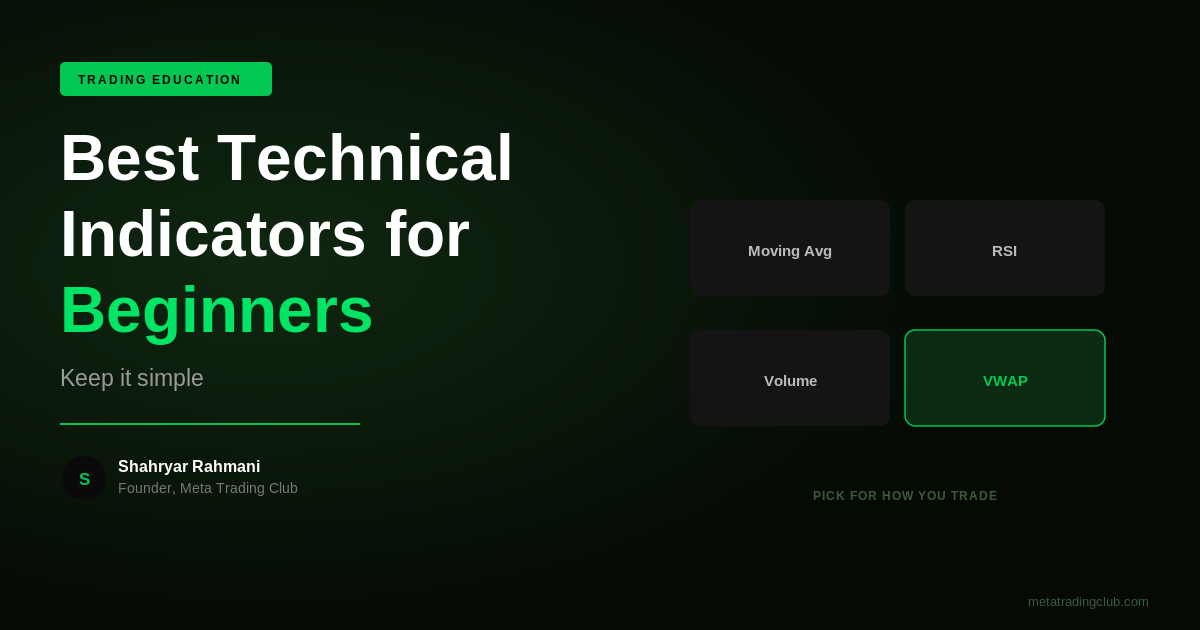
A moving average smooths price into a single line that shows the trend’s direction and acts as dynamic support or resistance. Beginners get the most value from one or two — a faster one (like the 20-period) and a slower one (like the 50 or 200). Price above a rising average suggests an uptrend; below a falling one suggests a downtrend. That’s most of the value: instant trend context. The 200-day moving average in particular is watched by everyone, which is part of why it works.
2. RSI (Momentum and Exhaustion)
The Relative Strength Index measures momentum on a 0–100 scale. Readings above 70 are traditionally ‘overbought’ and below 30 ‘oversold.’ The beginner trap is treating those as automatic sell/buy signals — in a strong trend, RSI can stay overbought for a long time. Use it instead as a read on momentum and exhaustion: divergence between RSI and price (price making a new high while RSI doesn’t) is a more useful warning than the raw level.
3. Volume (Conviction)
Volume isn’t flashy, but it tells you whether a move has conviction behind it. A breakout on heavy volume is more trustworthy than one on thin volume. A trend on declining volume may be running out of fuel. Volume confirms what price is doing — it answers ‘do participants actually believe this move?’ Most beginners ignore it, which is exactly why it’s valuable.
4. VWAP (Intraday Reference)
For anyone trading intraday, VWAP — the volume-weighted average price — is the single most useful reference. It shows the average price weighted by volume for the session and acts as a magnet and a line in the sand: price above VWAP is broadly bullish for the day, below is bearish, and reactions at VWAP are high-quality decision points. If you day trade, learn this one.
The Real Skill: Confluence, Not Quantity
Notice the theme — each indicator answers a different question: trend, momentum, conviction, intraday reference. That’s the point. You don’t want five indicators saying the same thing; you want a few that, together, build a complete read. The skill isn’t adding indicators — it’s recognizing when several independent reads line up (confluence) at the same level. That alignment is worth more than any single signal, and it’s exactly what a structured framework like the MTC Alignment Engine is built to systematize: bias, level, reaction, confirmation, execution.
Less Is More — Genuinely
If you take one thing from this: strip your chart down. Price, structure, one or two moving averages, and volume will take a beginner further than a screen full of contradicting oscillators. Add an indicator only when you can clearly state what question it answers that your existing tools don’t. Complexity feels like sophistication. It’s usually just noise.
At Meta Trading Club, members see a clean, structure-first read applied live every day — proof that a few well-understood tools beat a cluttered chart every time.
Proprietary Framework
The MTC Alignment Engine™ — Applied Every Live Session
Every trade runs the same five checkpoints — consistency over gut reaction. Inside the MTC Incubator, members build their own system on top of this framework.
Frequently Asked Questions
What are the best technical indicators for beginners?
A simple, effective set is one or two moving averages for trend, RSI for momentum and exhaustion, volume for conviction, and VWAP if you trade intraday. Each answers a different question, so together they build a complete read without cluttering the chart. Most beginners are better off mastering these few than stacking many.
How many indicators should I use?
Fewer than you think — often just two to four. The goal is a few tools that each answer a distinct question (trend, momentum, volume, intraday reference), not many indicators that repeat or contradict each other. A cluttered chart usually causes more confusion and hesitation, not better decisions.
Is RSI a good indicator for beginners?
Yes, if used correctly. RSI is useful for reading momentum and spotting exhaustion or divergence, but the common mistake is treating overbought (above 70) and oversold (below 30) as automatic sell and buy signals. In strong trends, RSI can stay extreme for a long time, so it’s best used as context, not a standalone trigger.
Are moving averages still useful in 2026?
Yes. Moving averages remain one of the simplest and most reliable ways to gauge trend direction and identify dynamic support and resistance. Widely-watched ones like the 50-day and 200-day are useful partly because so many traders watch them, which can make them self-reinforcing levels.
Do indicators actually work, or is it all just price?
Indicators are derived from price and lag it, so they confirm and contextualize rather than predict. They work best as supporting tools layered on a solid read of price structure — trend, support, and resistance. Reading price action well matters more than any single indicator; indicators add the most value when several independent ones align.
What is the most important thing for a beginner to learn on charts?
Reading price structure — higher highs and higher lows, support and resistance, and overall trend — before relying on indicators. Indicators are derived from price and only confirm what structure already shows. A trader who can read structure will get far more from a clean chart than one stacking indicators on a chart they can’t read.
Some links below are affiliate links — if you sign up through them, MTC may earn a commission at no extra cost to you. We only recommend tools we’d use ourselves.
Want to practice this with real tools? You can get started with a charting platform like TradingView.
Related reading
Meta Trading Club Community
Start Your 7-Day Free Trial
Daily live sessions. Real-time market prep — not signals. The MTC Alignment Engine™ applied in front of you. Trade alongside Shahryar from day one.
Cancel anytime. No contracts. Built for Canadian traders.
Already trading and want to build your own system?
The MTC Incubator is an application-based mentorship — 1-on-1 work building a personalized system on the Alignment Engine™.