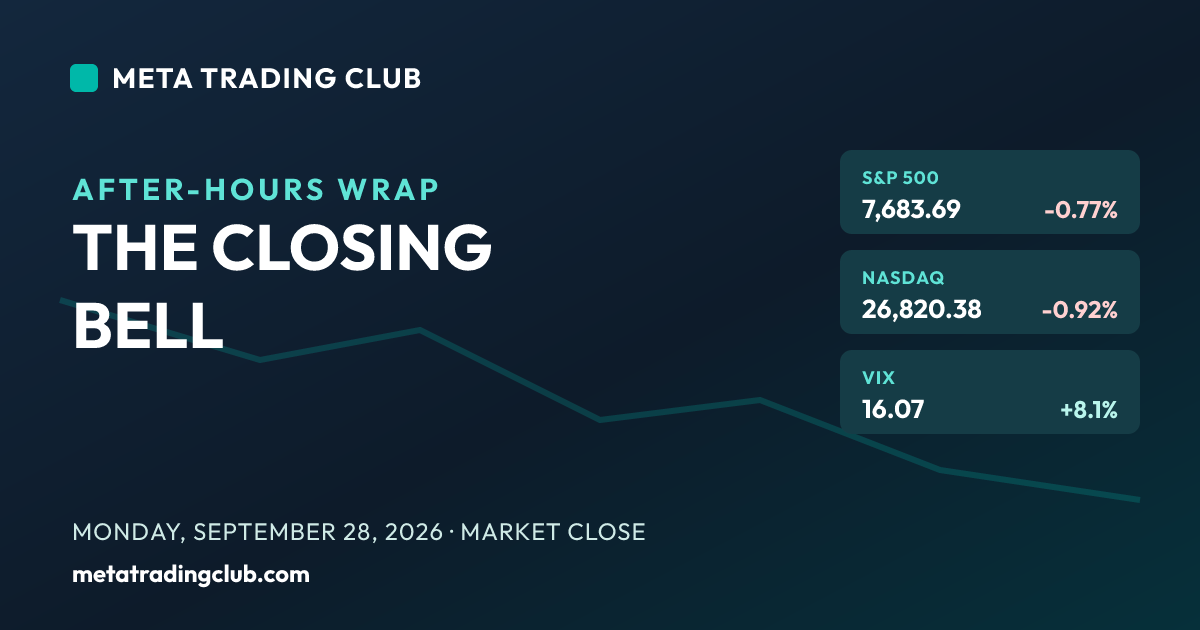
Monday, September 28, 2026 · 4:30 PM ET · MTC Market Close
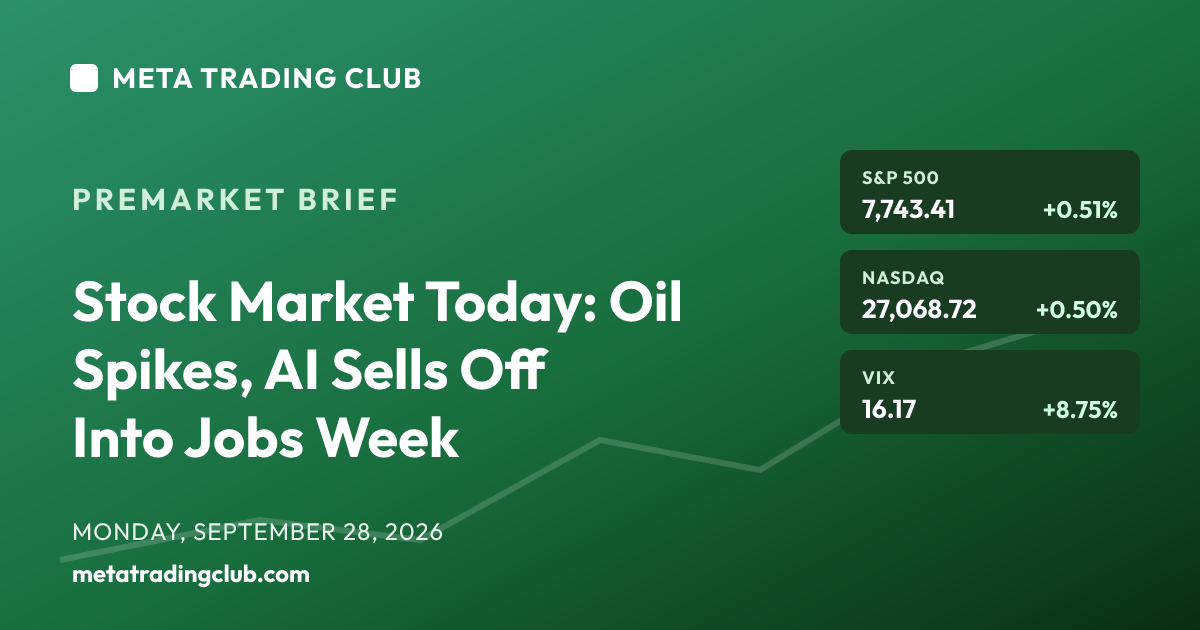
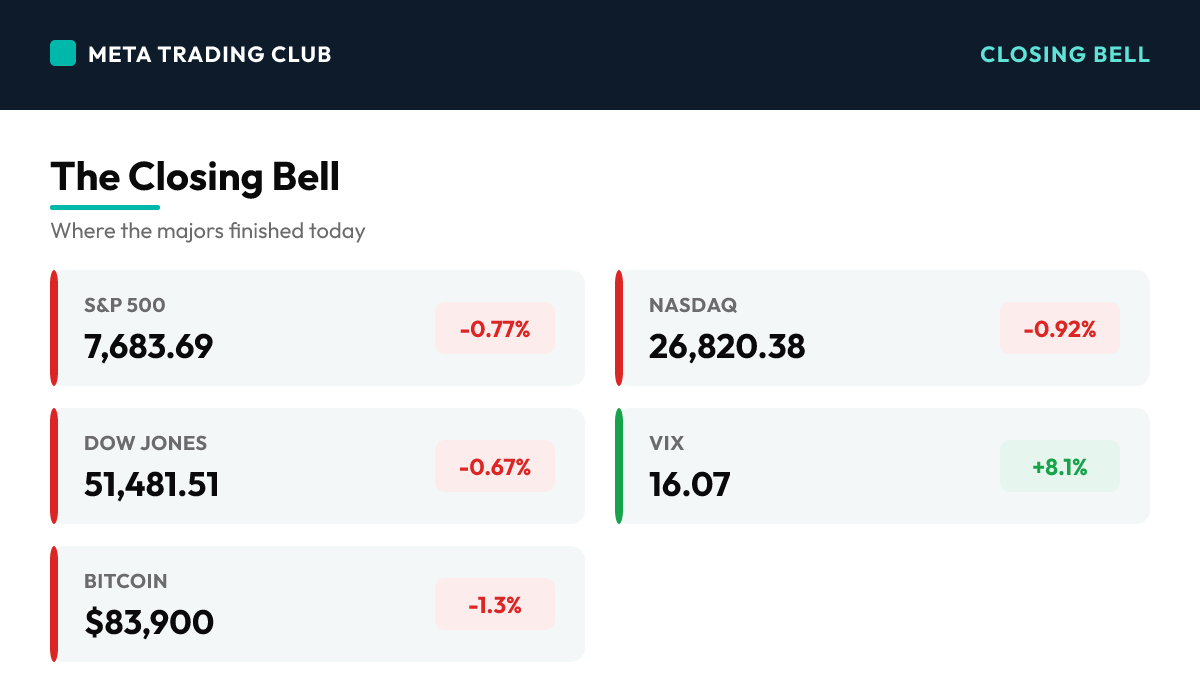
The stock market today buckled under the bond market. A 10-year Treasury yield that climbed to 5.24%, its highest since 2007, dragged every major index red, with the S&P 500 down 0.77% to 7,683.69, the Nasdaq off 0.92% and the Russell 2000 down 0.69%. Boeing (-7%) and MongoDB (-18%) supplied the marquee single-stock damage, gold got crushed 3.5% on the real-yield spike, and only the oil-driven energy complex leaned green. This was a rates-driven risk-off day, not a growth scare, and it hands Tuesday a clean binary: hold 7,650 with yields cooling, or lose it and let higher-for-longer take the wheel.
The Closing Bell
| Instrument | Close | Change | Note |
|---|---|---|---|
| S&P 500 | 7,683.69 | -0.77% | Fell about 59 points to close at 7,683.69, sliding back below the 7,700 round number that has framed this range. There was one reason: the 10-year Treasury yield jumped to 5.24%, its highest since 2007, repricing every rate-sensitive corner of the market lower at once. 7,650 is now the single most important level on the page. Hold it and this is an orderly yield pullback; lose it and 7,600 then 7,550 come back into play with the long end still climbing. |
| Nasdaq | 26,820.38 | -0.92% | The day’s biggest large-cap loser, down about 248 points as the long-duration growth complex took the brunt of the yield spike. When the risk-free rate jumps to a 2007 high, the highest-multiple assets get repriced first and hardest, and MongoDB’s 18% collapse on a CEO exit only added to the drag. This was duration getting sold, not a growth or earnings problem, and it keeps going while the 10-year keeps rising. |
| Dow Jones | 51,481.51 | -0.67% | Fell roughly 347 points, held down by Boeing’s near-7% drop after the FAA said it would not certify the 737 MAX 10 until it assesses a new software glitch. A single Dow component doing that much damage, on a day the whole tape was red on yields, is the signature of a broad risk-off session rather than a rotation. The Dow carries less duration than the Nasdaq, which is the only reason it finished ahead of it. |
| Russell 2000 | 2,821.00 | -0.69% | Down about 20 points, and the small-cap tell is simple: the most rate-sensitive, most domestically-levered corner of the market can’t fight a 10-year at a 2007 high. Small caps live and die on borrowing costs, so a day the long end prints fresh highs lands squarely on them. When the Russell leads the tape lower on a yield move, higher-for-longer is the dominant force again. |
| VIX | 16.07 | +8.1% | Jumped about 8% but is still parked near 16, a reminder that this was an orderly repricing, not a panic. Volatility firmed as the broad tape sold off, yet a sub-17 VIX says the selling was steady and mechanical, a rates-driven markdown rather than a fear-driven flush. The trap is reading a calm VIX as an all-clear when the actual pressure, the 10-year at 5.24%, has not eased at all. |
| 10-Year Yield | 5.24% | +6 bp | The single most important number on the page and the reason the whole tape was red. The 10-year climbed about 6 basis points to 5.24%, its highest level since 2007, while the 30-year rose to 5.56%, its highest since 2004. Rising oil on renewed Iran tensions fed the inflation fear pushing the long end up. Until the 10-year backs decisively lower, the higher-for-longer problem is fully in the driver’s seat. |
| WTI Crude | $92.60 | +0.2% | Ticked higher into the settle, holding near $92.60 after touching intraday highs above $96 on renewed U.S.-Iran tensions. President Trump rejected Iran’s ceasefire proposal, keeping a geopolitical risk premium in crude even as Iran later signaled it would suspend uranium enrichment for sanctions relief. Rising oil is a double-edged read: it lifts Energy but feeds the exact inflation fear driving yields higher. Level approximate into the settle. |
| Gold | $4,168 | -3.5% | Got hit hard, tumbling about $153 or 3.5% to settle near $4,168 an ounce. The surge in real yields raised the opportunity cost of holding a non-yielding asset, and a 10-year at 5.24% is a direct headwind for gold. Even with a live Middle East backdrop, the rate move won the day, and gold’s slide dragged the materials complex with it. Level approximate into the settle. |
| Bitcoin | $83,900 | -1.3% | Slipped about 1.3% to hold near $83,900 as the broad risk tape sold off on the yield spike. Bitcoin did not lead the selling the way high-beta tech did, but a rising real-yield backdrop is a headwind for every speculative asset, so the modest give-back is consistent with the day’s risk-off tone. Level approximate into the settle. |
Today’s Charts
Daily candlestick charts with 20/50/200-day moving averages — the index majors, the day’s biggest mover on each side, and the leading sector ETF.

Charts: Finviz (daily). Levels and overlays update through the next session.
Sector Scoreboard
What Drove The Day
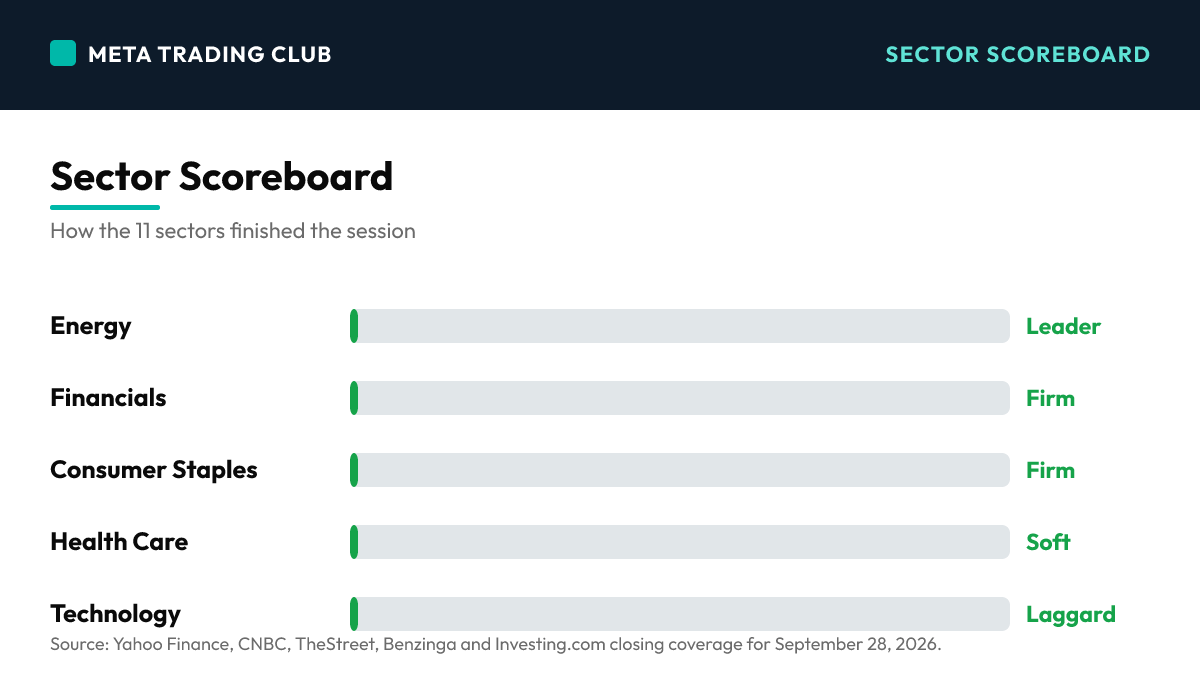
This was a textbook rates-driven risk-off session, and the trigger sat in the bond market. The 10-year Treasury yield pushed to 5.24%, its highest since 2007, and the 30-year to 5.56%, its highest since 2004, and that single move repriced tech, small caps, real estate and materials lower at once. The order of the damage told the story: Nasdaq worst, then S&P and Russell, with the Dow held back mainly by Boeing’s FAA setback rather than duration. Gold’s 3.5% collapse and a firming VIX confirmed the read; only the oil-and-Iran-driven energy complex could lean green. Nothing about growth broke today. The risk-free rate simply went up, and everything priced against it went down.
MAJOR HEADLINES AND CATALYSTS
Top Market-Moving Stories
- 10-YEAR YIELD HITS HIGHEST SINCE 2007 (Day) – The bond market did the damage. The 10-year Treasury yield climbed about 6 basis points to 5.24%, its highest level since 2007, while the 30-year rose to 5.56%, its highest since 2004. Renewed U.S.-Iran tensions lifted oil and stoked inflation fear, and a yield move of this kind repriced the longest-duration assets, growth and small caps, the hardest. This is the gravity on the whole market right now: strong nominal growth keeps the Fed restrictive, and every asset prices against a rising risk-free rate.
- BOEING SINKS ~7% ON FAA CERTIFICATION DELAY (Day) – Boeing was the single biggest drag on the Dow, closing down nearly 7% after the FAA said it would not certify the 737 MAX 10 until it assesses a newly discovered software glitch affecting navigation on certain aircraft. A delay of this size pushes the program’s revenue runway further out and put a marquee red print on an already-heavy tape.
- MONGODB COLLAPSES ~18% AS CEO DEPARTS FOR META (Day) – MongoDB tumbled about 18% after President and CEO Chirantan ‘CJ’ Desai stepped down to become chief enterprise platform officer at Meta Platforms, with the board naming Dev Ittycheria interim President and CEO. A leadership shock at a high-multiple growth name, on the exact day duration was getting sold hardest, made it the worst single-stock story in the S&P.
- IRAN TENSIONS KEEP AN OIL BID, ENERGY LEANS GREEN (Day) – Crude held a geopolitical premium after President Trump rejected Iran’s ceasefire proposal, with WTI touching intraday highs above $96 before settling near $92.60. Iran later signaled it would suspend uranium enrichment in exchange for sanctions relief, easing some of the tail risk, but energy was the one corner of the tape that could lean green. The catch: the same rising oil feeds the inflation fear driving yields higher.
AFTER-HOURS EARNINGS SPOTLIGHT
Jefferies Kicks Off the Bank Quarter
- JEFFERIES (JEF) LEADS OFF WALL STREET’S EARNINGS SEASON (AH) – Jefferies reported its fiscal Q3 results shortly after the close, at roughly 4:16 PM ET, the first big Wall Street name out of the gate each quarter. Consensus called for about $1.04 per share. Because Jefferies reports weeks ahead of the money-center banks, its advisory and trading numbers are the market’s first real read on whether the M&A revival is actually showing up in fees, setting the tone for the larger banks to follow.
- A THIN POST-CLOSE SLATE LET MACRO OWN THE TAPE (AH) – Outside Jefferies, the after-hours earnings slate was light, which kept the spotlight exactly where it has been all session: on the bond market. With no heavyweight tech or mega-cap print to shift the narrative, the 10-year at a 2007 high stayed the story into the evening.
WHAT IT SETS UP FOR TUESDAY
A Data-Heavy Session With Yields in Charge
- CONSUMER CONFIDENCE AND JOLTS HEADLINE TUESDAY (AH) – The economic calendar turns busy: September Consumer Confidence is expected around 90.1 versus 89.4 prior, and JOLTS job openings are seen near 7.23 million versus 7.27 million. Both land at 10:00 AM ET, alongside the S&P/Case-Shiller home-price index and a full slate of Fed speakers. On a tape this sensitive to rates, a hot labor read would pour fuel on the yield move; a soft one is the bulls’ best hope for relief.
- THE 10-YEAR IS THE ONLY CHART THAT MATTERS (AH) – Everything keys off the long end. If the 10-year backs off 5.24% on Tuesday’s data, the pullback stays orderly and 7,650 holds. If it pushes higher, the duration selling that defined today keeps going, and the S&P’s grip on 7,650 gets tested in a hurry.
Winners & Losers
Winners
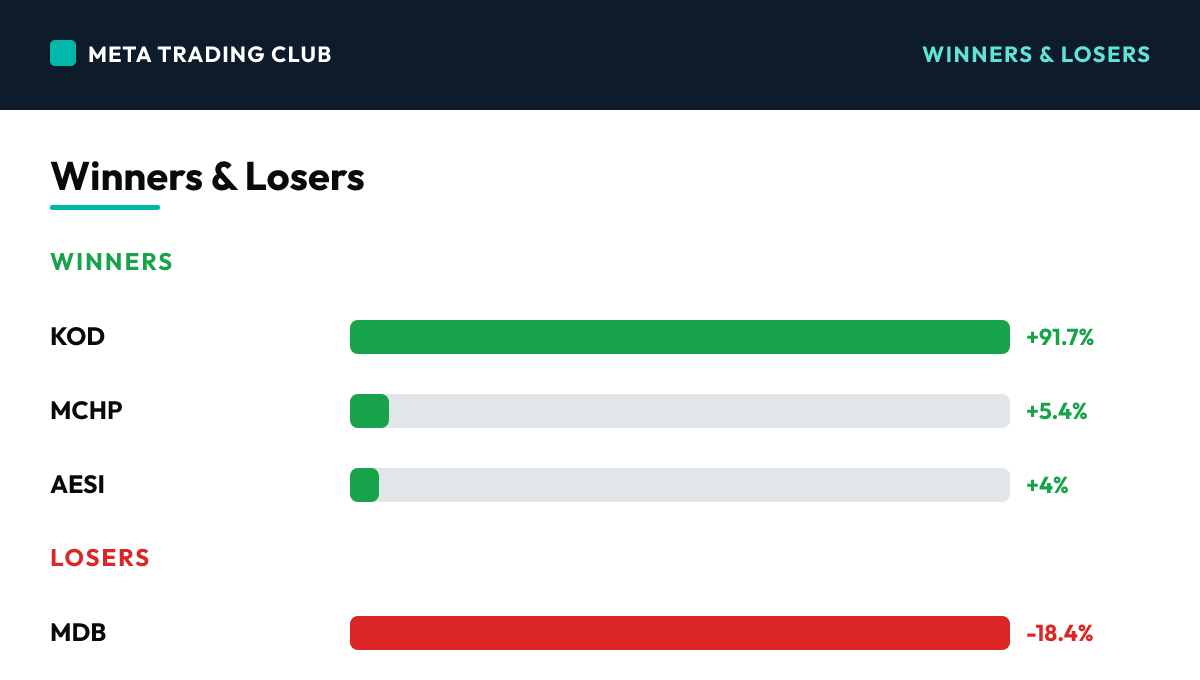
| KOD | +91.7% | Kodiak Sciences exploded higher, more than 90%, on a clinical/pipeline catalyst that made it the day’s runaway single-stock winner. A speculative biotech doing this is a reminder that risk appetite still lives in pockets even on a broad risk-off day, though a lottery-ticket move like this says nothing about the tape’s health. | |
| MCHP | +5.4% | Microchip Technology ran about 5.4% as one of the cleaner large-cap winners, riding durable semiconductor and industrial-chip demand. A fundamentals-driven gain that stood out on a board where almost everything was red, and one of the few chip names to hold up while the broader Nasdaq sold off on duration. | |
| AESI | +4% | Atlas Energy Solutions rode the oil bid, gaining alongside the energy complex as crude held its geopolitical premium on the Iran headlines. A rate-and-oil day where Energy was the lone green sector put the energy-services names among the day’s better performers. Move approximate. |
Losers
| MDB | -18.4% | MongoDB was the worst single-stock story in the S&P, collapsing about 18% after CEO CJ Desai stepped down to take a senior role at Meta, with the board naming an interim chief. A leadership shock at a high-multiple growth name, on the exact day duration was getting sold hardest, was a brutal double hit. | |
| BA | -6.9% | Boeing fell nearly 7% and was the single biggest drag on the Dow after the FAA said it would delay certification of the 737 MAX 10 pending a review of a newly found software glitch. A certification delay pushes the program’s revenue further out, and a marquee industrial name doing this much damage weighed on the whole blue-chip complex. | |
| NEM | -4% | Newmont slid with the metals as gold’s 3.5% collapse hammered the miners. A day the real-yield spike crushed non-yielding assets was always going to hit the gold complex, and the largest miner led the materials sector lower. Move approximate. |
What It Sets Up For Tomorrow
Levels Into Tomorrow
- S&P 500 7,650 – THE LINE THAT DECIDES IT. Price closed at 7,683.69, sitting just above the 7,650 shelf that now frames the whole read. This is the single most important level on the page. Hold 7,650 and today’s drop stays an orderly, rates-driven pullback with the bulls keeping the benefit of the doubt. Lose it decisively, especially with the 10-year still above 5.20%, and today’s red breadth becomes the story, opening 7,600 then 7,550. The first clean move relative to 7,650 tells you who owns the tape into month-end.
- S&P 500 7,700 – THE RECLAIM LEVEL. The round number the index slipped back below today and the first hurdle for any bounce. Reclaim 7,700 and hold it, ideally on the 10-year easing, and this whole session gets written off as a one-day yield tantrum. Fail there and the sellers keep the upper hand. Watching how price behaves at 7,700 on the way back up is the cleanest tell that buyers have regained control.
- S&P 500 7,600 – THE SHELF BELOW. The next real support if 7,650 gives way. As long as the S&P holds the 7,600 to 7,650 zone, the pullback stays inside the range. Lose 7,600 and the market is telling you the yield spike is winning and higher-for-longer has taken the wheel, with month-end positioning likely to accelerate the move.
Bull case: Today was a one-day rates tantrum, not the start of a downtrend. The economy is not breaking, earnings are not the problem, and the whole move traces to a single 6-basis-point push in the 10-year. If Tuesday’s Consumer Confidence or JOLTS come in soft, the yield pressure eases, 7,650 holds, and the buyers who have defended every dip this quarter step right back in. A calm VIX near 16 says the selling was orderly, not a flush, and orderly pullbacks in an uptrend are where the next leg is bought.
Bear case: A market that sells off on a 10-year at a 2007 high has a rates problem it cannot easily shake. If Tuesday’s data runs hot, the long end pushes past 5.25%, and the same duration selling that hit tech, small caps, real estate and materials today simply continues. Lose 7,650 with yields still climbing and today’s ugly breadth stops being a one-off and starts being the trend, with 7,600 and 7,550 the next stops.
Risks Into Tomorrow
- When the market sells off on rising rates, watch the bond market, not the tape — Stocks fell hard today for one reason: the 10-year Treasury yield hit its highest level since 2007. That is the entire story, and it only makes sense through one lens. The market is not worried about growth, it is worried about what a rising risk-free rate does to every asset priced against it. Higher yields reprice tech, small caps, real estate and gold all lower at once, regardless of how the underlying businesses are doing. Traders get whipsawed when they stare at the index instead of the driver. The discipline is to read the bond market first. When yields spike and stocks drop, you are in a rates-driven regime, and in that regime the yield curve is your lead indicator, not the price of the S&P. No alignment between the tape and its cause means you wait for yields to settle before you trust any bounce.
- Duration breaks first, so the Nasdaq and Russell name the driver — The order of today’s damage was not random. The Nasdaq fell 0.92%, the S&P 0.77%, the Russell 0.69%, and the Dow 0.67%, held back mainly by a single stock in Boeing. Strip that out and the pattern is a clean duration read: the highest-multiple, longest-duration assets break first and hardest when the risk-free rate jumps. This is a repeatable tell. When the Nasdaq leads the tape down on a yield move, you are almost always looking at a rates story, not an earnings or growth scare. The skill is to read that spread as a diagnostic: it names the cause of the selloff and therefore what has to change for it to end. Here, nothing heals until the 10-year backs off. Stop watching the index for your signal and start watching which parts of the market are breaking.
- A calm VIX on a red tape is patience, not permission — The VIX jumped about 8% today but is still parked near 16, and that low reading can be a trap. It tells you the selling was orderly and mechanical, a steady repricing rather than a panic, and traders read a calm VIX as a sign the worst is over. But the actual source of the pressure, the 10-year at 5.24%, has not eased at all. Low volatility does not mean low risk when the underlying driver is fully intact. The mistake is to buy the dip because the VIX is calm, when calm just means the market is repricing efficiently, not that it is done. The plan is to separate the emotion gauge from the cause: watch the yield curve for the all-clear, not the VIX. Until the 10-year turns lower, a quiet VIX on a red tape is a reason for patience, not a green light.
Frequently Asked Questions
How did the S&P 500 close today?
On Monday, September 28, 2026, the S&P 500 closed at 7,683.69 (-0.77%), with the VIX at 16.07. The stock market today buckled under the bond market.
What drove the market today?
10-YEAR YIELD HITS HIGHEST SINCE 2007 (Day) – The bond market did the damage. The 10-year Treasury yield climbed about 6 basis points to 5.24%, its highest level since 2007, while the 30-year rose to 5.56%, its highest since 2004. Renewed U.S.-Iran tensions lifted oil and stoked inflation fear, and a yield move of this kind repriced the longest-duration assets, growth and small caps, the hardest. This is the gravity on the whole market right now: strong nominal growth keeps the Fed restrictive, and every asset prices against a rising risk-free rate.
What levels matter for tomorrow?
S&P 500 7,650 – THE LINE THAT DECIDES IT. Price closed at 7,683.69, sitting just above the 7,650 shelf that now frames the whole read. This is the single most important level on the page. Hold 7,650 and today’s drop stays an orderly, rates-driven pullback with the bulls keeping the benefit of the doubt. Lose it decisively, especially with the 10-year still above 5.20%, and today’s red breadth becomes the story, opening 7,600 then 7,550. The first clean move relative to 7,650 tells you who owns the tape into month-end. S&P 500 7,700 – THE RECLAIM LEVEL. The round number the index slipped back below today and the first hurdle for any bounce. Reclaim 7,700 and hold it, ideally on the 10-year easing, and this whole session gets written off as a one-day yield tantrum. Fail there and the sellers keep the upper hand. Watching how price behaves at 7,700 on the way back up is the cleanest tell that buyers have regained control. S&P 500 7,600 – THE SHELF BELOW. The next real support if 7,650 gives way. As long as the S&P holds the 7,600 to 7,650 zone, the pullback stays inside the range. Lose 7,600 and the market is telling you the yield spike is winning and higher-for-longer has taken the wheel, with month-end positioning likely to accelerate the move.
How does Meta Trading Club prepare for the next session?
We wrap every session and carry the read forward through the MTC Alignment Engine — bias, level, reaction, confirmation, execution, targets. No alignment, no trade. Learn the full process inside the MTC Incubator.
New to this? Start with the free training.
Learn how we read the market before you risk a dollar — our free education library and ebook break down the fundamentals step by step.
Free education → Get the free ebookThe session’s over. The prep isn’t.
This is how MTC members close each day — wrap what happened, mark the levels, and carry one clean read into tomorrow. If you want to build that habit and qualify your own A+ setups instead of chasing alerts, the MTC Incubator is mentorship and a repeatable process. It’s application-based — see if it’s a fit.
Explore the MTC Incubator → Apply nowSources: Yahoo Finance, CNBC, TheStreet, Benzinga and Investing.com closing coverage for September 28, 2026.. For educational purposes only. Not financial advice.