Before indicators, before news, before any strategy — there’s structure.
Market structure is the most fundamental concept in technical analysis, and it’s the one most traders either skip over or never properly understand. It sounds basic: just look at the highs and lows. But the traders who consistently execute well in the market aren’t using more complex tools — they’re reading structure more clearly.
When you understand market structure, you stop looking at price as random noise. You start seeing patterns of behavior — where the market has shown strength, where it’s broken down, where buyers and sellers are fighting for control, and where the clear path of least resistance is. That clarity changes everything about how you trade.
This guide breaks down market structure from the ground up. What it is, how trends and ranges are defined by it, how structure breaks signal reversals, how to apply it to options trading decisions, and how timeframe alignment takes the whole concept to the next level.
The skill under every setup
Indicators come and go. Market structure — the pattern of highs and lows — is the language price actually speaks.
What Is Market Structure in Trading?
Market structure is simply the pattern of highs and lows that price creates over time. That’s it. Every chart, on every timeframe, is just a sequence of highs and lows. Market structure is the framework for interpreting what those highs and lows mean.
The core idea is that markets move in phases — trending phases where price is consistently pushing in one direction, and consolidation phases where it’s moving sideways before making the next move. Structure tells you which phase you’re in and, critically, when a phase has changed.
Traders who don’t understand market structure often feel like the market is random and unpredictable. That’s because without structure, it kind of is. With structure, you have a framework that tells you where you are and what to look for next.
MTC Analysis
Reading Trend From Structure
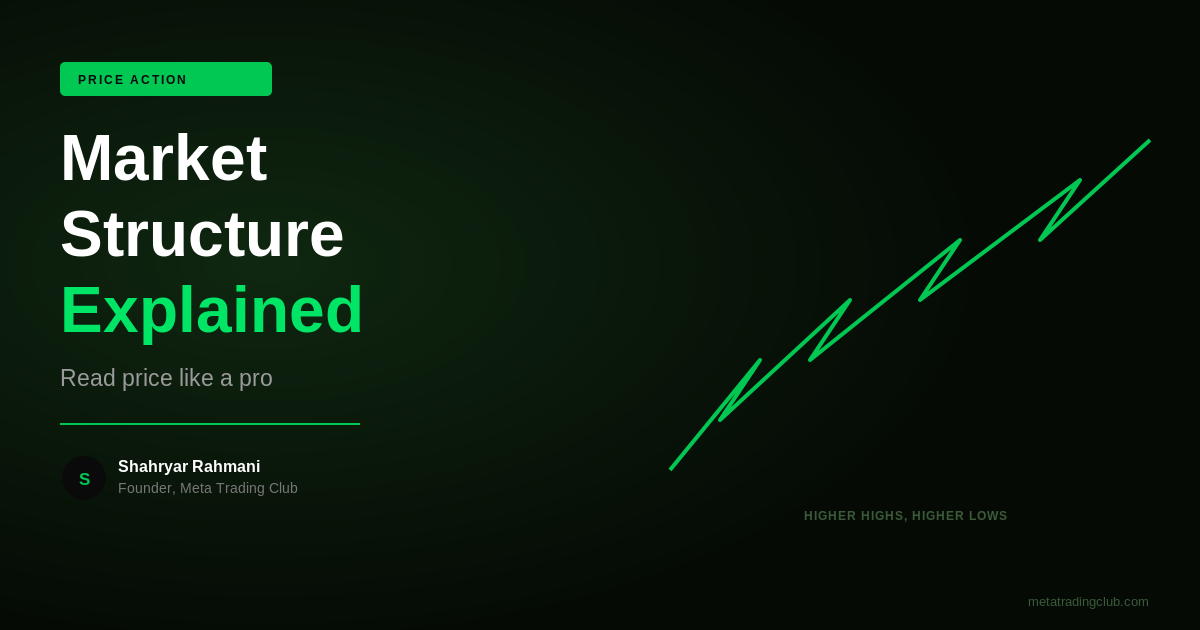
Higher highs and higher lows define an uptrend; the opposite defines a downtrend. Structure tells you the path of least resistance before any indicator does.
Uptrend Structure: Higher Highs and Higher Lows
An uptrend is defined by a pattern of higher highs (HH) and higher lows (HL).
Each time price makes a new high, it then pulls back — but the pullback finds support at a higher level than the last pullback. This sequence of HH-HL-HH-HL is the visual signature of a market that buyers are in control of.
What this means practically:
- Each higher low is a potential entry zone for traders looking to buy the trend
- The most recent higher high is a resistance level to watch
- As long as the pattern of higher lows holds, the uptrend is intact
- A break of the most recent higher low is the first warning that structure may be shifting
In an uptrending market, the trading discipline is to look for long setups near areas of higher lows — not to chase price into extended highs where risk/reward has deteriorated.
Downtrend Structure: Lower Highs and Lower Lows
The mirror image of an uptrend. A downtrend is defined by a pattern of lower highs (LH) and lower lows (LL).
Price makes a new low, bounces — but the bounce stalls at a lower level than the previous bounce. Then it breaks to new lows again. Each lower high is a resistance level where sellers have re-entered. Each lower low confirms their control.
Practical implications:
- Each lower high is a potential entry zone for traders looking to trade the downside
- As long as the pattern of lower highs holds, the downtrend is intact
- A break above the most recent lower high is the first warning that structure may be reversing
Understanding downtrend structure is particularly relevant for options traders looking at puts. Trading the downside isn’t just about picking a direction — it’s about identifying where structure is confirming the move.
Range-Bound Markets: When Neither Side Has Control
Not every market is trending. Between trending phases, price often enters a range — moving laterally between a defined high (resistance) and a defined low (support).
In a range, neither buyers nor sellers are consistently winning. Price oscillates between the boundaries, often with lower volume and less decisive moves.
Range characteristics:
- Clear ceiling (resistance) where price repeatedly rejects
- Clear floor (support) where price repeatedly bounces
- Decreasing conviction in moves toward either extreme
- Often precedes a breakout move in one direction
For traders, ranges have two main approaches: trade the range (buy near support, sell near resistance) or wait for the breakout and trade the expansion. Which approach is right depends on the context — the broader structure on higher timeframes, the duration of the range, and how price is behaving near the boundaries.
How Structure Breaks Signal Potential Reversals
The most actionable moment in market structure analysis is the break.
In an uptrend, a structure break occurs when price violates the most recent higher low and continues lower. This doesn’t automatically mean the uptrend is over — it means the first piece of evidence has appeared that the character of the market may be changing.
Common structure break signals to watch:
- Price breaks below the most recent swing low in an uptrend (potential trend reversal warning)
- Price breaks above the most recent swing high in a downtrend (potential trend reversal warning)
- Price breaks out of a prolonged range on strong volume (trend initiation signal)
Structure breaks become more significant when they happen on higher timeframes. A structure break on a 5-minute chart is noise. A structure break on the daily chart is a different conversation entirely.
This is why timeframe context matters so much — which we’ll cover in the next section.
Key Levels Within Structure
Not all price levels are equal. Within any market structure, certain levels carry more weight because of what happened there historically.
Swing highs and lows: The most recent significant highs and lows in the structure. These are the reference points that define whether structure is intact or broken.
Areas of confluence: Levels where multiple reference points overlap — for example, a previous swing high that aligns with a round number and a weekly level. The more reasons a level has to matter, the more likely it is to matter.
Consolidation zones: Areas where price spent significant time moving sideways. These zones tend to act as support or resistance when price returns to them, because they represent areas where a lot of buying and selling activity happened.
Prior breakout levels: When price breaks through a level and accelerates, that level often becomes relevant again when price comes back to it — what was resistance can become support, and vice versa.
Learning to identify and mark these levels clearly on a chart — without cluttering the chart with every possible level — is one of the highest-leverage skills in technical analysis.
Market Structure in Options Trading Decisions
Understanding market structure isn’t just relevant for stock traders. For options traders, it directly informs how you choose direction, strike selection, and timing.
Direction: An options trade is a directional bet. If you’re buying calls, you need a bullish bias that’s supported by structure — not just a feeling. If the market is in a downtrend with a clear series of lower highs and lower lows, buying calls because ‘it’s oversold’ is trading against structure.
Strike selection: Structure tells you where the market is likely to move toward and where it’s likely to stall. If you know the next key resistance level is at X, you can select strikes and set profit targets relative to that level. If you’re guessing at structure, strike selection becomes arbitrary.
Timing: Buying options too early — before structure confirms the move — is a common mistake. Waiting for a structure-based confirmation before entering (a bounce off support, a breakout above a key level) dramatically improves the quality of entries.
Defined risk structures: For traders using spreads, understanding structure helps you define where your setup is wrong. If you’re in a bull call spread and the market breaks below the last higher low, you have a structure-based reason to manage the trade.
Timeframe Alignment: Higher vs Lower Timeframe Structure
Here’s where market structure analysis gets more powerful — and where most retail traders fall short.
A setup doesn’t exist in isolation on one timeframe. It exists within the context of the larger timeframe above it. This is timeframe alignment, and it’s one of the most important concepts in the MTC Alignment Engine.
The rule is simple: higher timeframes define the bias; lower timeframes provide the entry.
If the daily chart shows a clear uptrend, you have a higher timeframe bullish bias. On the 1-hour chart, you look for setups that align with that bias — pullbacks to key levels, consolidations near support, or breakouts that confirm the daily trend. You’re not fighting the daily structure on the 1-hour.
Conversely, if you see a beautiful-looking bullish setup on the 15-minute chart but the daily is in a clear downtrend below key moving averages with recent lower highs, you’re fighting the higher timeframe. The probability is lower. The setup quality is lower.
| Timeframe | Role in Structure Analysis |
|---|---|
| Weekly | Macro trend and major structural levels |
| Daily | Primary bias for active traders |
| 4-Hour | Intermediate structure, key swing levels |
| 1-Hour | Refined entry zones, intraday structure |
| 15-Min / 5-Min | Trigger timeframe, confirmation signals |
Alignment across multiple timeframes — daily bullish, hourly bullish, 15-minute showing a bounce off a key level — dramatically increases setup quality.
How MTC Teaches Market Structure as Part of the Alignment Engine
Market structure is baked into how we teach trading at Meta Trading Club.
The MTC Alignment Engine’s 5-step process starts with Market Bias (Step 1) and Key Level identification (Step 2) — both of which are direct applications of market structure analysis. Before we ever look for a trigger or confirmation signal, we establish what the structure says. Where is the market? What has it been doing? Where are the levels that matter?
This isn’t abstract theory — it’s applied every single morning in our live premarket sessions. We read the structure on the higher timeframes, identify the key levels for the day, and use that context to frame everything we look for during the session.
For newer traders, understanding the options chain and options mechanics is important. But structure is what tells you which direction to trade. Check out our options trading beginner’s guide and our how to read an options chain post for more on the mechanics side.
Trade What You Can See, Not What You Hope For
Market structure is the closest thing trading has to an objective framework. Price either made a higher high, or it didn’t. It either held the higher low, or it broke. There’s less ambiguity than most traders think.
At Meta Trading Club, structure is the foundation of everything we do — from the morning premarket session to live trade execution. We teach you to read what’s actually in front of you, not guess at what might happen.
Proprietary Framework
The MTC Alignment Engine™ — Applied Every Live Session
Every trade runs the same five checkpoints — consistency over gut reaction. Inside the MTC Incubator, members build their own system on top of this framework.
Frequently Asked Questions
What is market structure in trading?
Market structure is the pattern of highs and lows that price creates over time on a chart. It defines whether a market is in an uptrend (higher highs and higher lows), a downtrend (lower highs and lower lows), or a range (price oscillating between defined support and resistance). Understanding market structure allows traders to identify the current market phase, find high-probability entry zones, and recognize when the market’s character is changing.
What does a structure break mean in trading?
A structure break occurs when price violates a significant swing point that was defining the current trend. In an uptrend, a structure break happens when price moves below the most recent higher low. In a downtrend, it happens when price moves above the most recent lower high. A structure break is the first signal that the trend may be weakening or reversing — though it requires confirmation on higher timeframes before drawing strong conclusions.
How do you identify key levels in market structure?
Key levels in market structure are identified by looking for swing highs and lows, areas of consolidation, and zones where price has previously reacted strongly. The most important levels tend to be on higher timeframes (daily, weekly) and are often areas where multiple reference points align — sometimes called confluence zones. Fewer, higher-quality levels marked on a chart are more useful than marking every possible level.
What is the difference between market structure on different timeframes?
Higher timeframes (weekly, daily) show the macro structure and define the overall trend bias. Lower timeframes (1-hour, 15-minute) show the more granular structure that traders use for entry timing. The key principle is timeframe alignment — when the structure on multiple timeframes points in the same direction, setup quality is higher. A bullish setup on a 15-minute chart is stronger when the daily and hourly structure are also bullish.
How does market structure apply to options trading?
Market structure directly informs options trading decisions. The direction of the trend from market structure tells you whether to be leaning bullish (calls) or bearish (puts). Key structural levels tell you where to place profit targets and where a trade is structurally invalidated. Structure-based entries — waiting for a reaction at a key level before entering — improve timing and reduce the chance of entering in the middle of a range with no clear direction.
Is market structure the same as support and resistance?
Market structure and support/resistance are closely related but not identical. Support and resistance refers to specific price levels where buying or selling has historically occurred. Market structure is the broader framework of how those highs and lows are arranged — whether they’re forming a trend or a range. Key support and resistance levels are found within the structure, but structure also tells you whether those levels are in an uptrend or downtrend context, which affects how you interpret reactions to them.
Meta Trading Club Community
Start Your 7-Day Free Trial
Daily live sessions. Real-time market prep — not signals. The MTC Alignment Engine™ applied in front of you. Trade alongside Shahryar from day one.
Cancel anytime. No contracts. Built for Canadian traders.
Already trading and want to build your own system?
The MTC Incubator is an application-based mentorship — 1-on-1 work building a personalized system on the Alignment Engine™.
Related reading
- Support and Resistance Trading: The Complete Guide for Options Traders
- How to Develop Your Own Trading System From Scratch
Want to learn this live? Trade alongside us inside the MTC community — start your 7-day free trial.
Some links below are affiliate links — if you sign up through them, MTC may earn a commission at no extra cost to you. We only recommend tools we’d use ourselves.
Want to chart these setups yourself? We use TradingView for fast, clean charts.