The Sunday Setup · Trading week ending August 14, 2026 · ~6 min read
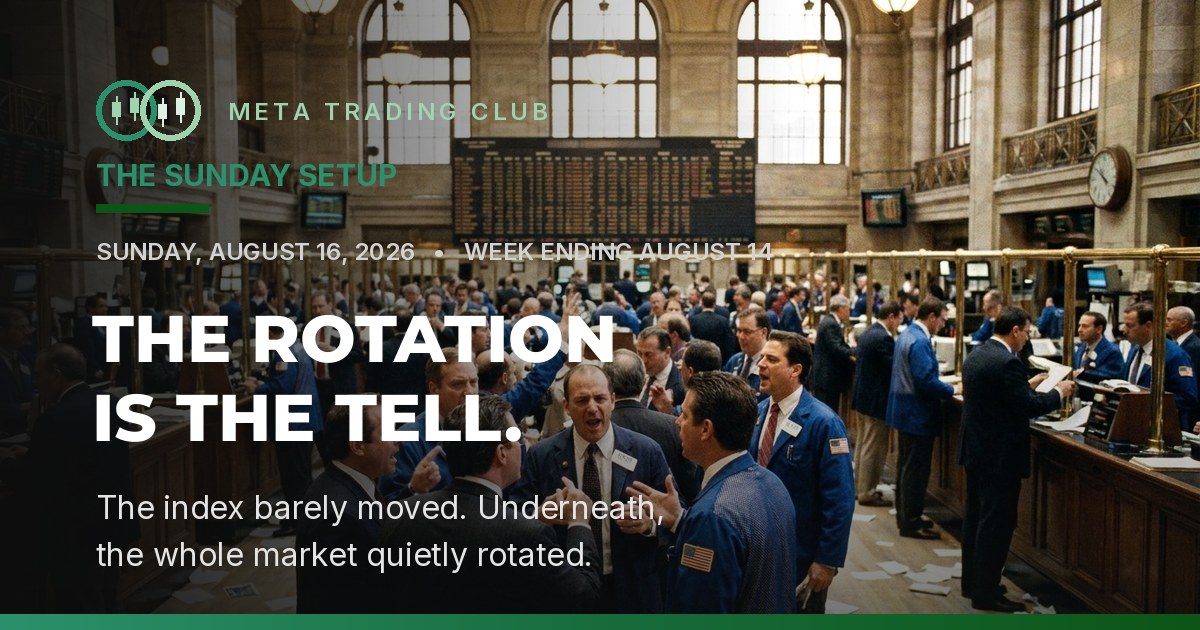
If you only glanced at the S&P this week, you’d think nothing happened. It closed up four tenths of a percent. The Nasdaq barely moved. On the surface, the quietest week in a month.
Look one layer down and it was one of the busiest. The Russell 2000 — the small caps — ripped to a fresh record and led the whole market. The Dow went red. Same five days, opposite directions, depending on what you owned. The tape didn’t go sideways. It rotated.
Here’s the shift, and it’s the whole story in one line: a flat index can be hiding a violent move underneath. A tame inflation print on Wednesday quietly drained the last of the market’s rate-hike fear — and when that fear leaves, money doesn’t sit still. It rotates out of the crowded mega-caps and into the rate-sensitive names left for dead. The headline number was the decoy. The rotation was the tell. For the next six minutes, we’ll break the week down the way we’d break down a single setup — and by the end you’ll read a “nothing” week the way a professional does.
The Scoreboard
Fresh records — but the leadership flipped. The Russell 2000 and the S&P 500 both closed at records, yet the smallest, most rate-sensitive companies led while the blue-chip Dow finished red and snapped a two-week streak.
| Index | Close | Week |
|---|---|---|
| Russell 2000 ★ | 3,068.42 | ▲ +1.1% |
| S&P 500 ★ | 7,785.76 | ▲ +0.4% |
| Nasdaq Composite | 26,729.16 | ▲ +0.1% |
| Dow Jones | 53,732.41 | ▼ −0.6% |
★ Fresh records for the Russell 2000 and the S&P 500 — but leadership flipped to the small caps while the Dow went red. VIX closed at 14.85, a multi-month low.

Small caps up, Dow down, volatility asleep — that combination is the fingerprint of a rotation, not a rally. Last week the whole tape ripped together on a weak jobs report: one big macro relief that lifted everything at once. This week the relief kept working, but it stopped lifting everything and started sorting. The money hiding in the giant, safe names went looking for the trade with more room to run — and found it in the corner of the market that benefits most from cheaper money: small caps.

Read the catalyst. Trade the leaders, not the average. A flat index is not a quiet market — it’s often a market making its biggest decision of the month while the headline sits still.
Decoded: The Two That Actually Matter
1. A tame CPI drained the last of the hike fear — and the money rotated
Wednesday’s July inflation report was the quiet catalyst that ran the whole week. Headline CPI rose just +0.1% on the month (3.4% year-over-year); core came in at +0.2% (2.5% year-over-year). Cool. Not a shock — a confirmation. And confirmation is exactly what a nervous tape needed to finally let go of the fear that the Fed might have to stay hawkish.

Imbalance: when rate-hike fear leaves, capital doesn’t stay parked in the crowded, defensive mega-caps. It flows out the risk curve — into the small, rate-sensitive names that gain the most from cheaper money.
Positioning: the tell was the leaderboard. Small caps to a record, blue-chip Dow red, Treasury yields easing. That’s not a bet on faster growth — it’s a bet on cheaper money.
The lesson hiding in the numbers: flat is not the same as quiet. A market can close unchanged and still hand you the biggest tell of the month underneath the surface. If you only watch the index, you miss it. If you watch what’s leading, you see the money move before the headline catches up.
2. Volatility fell asleep — and that cuts both ways
The VIX — the market’s fear gauge — drifted down to 14.85, a multi-month low. On one hand, that’s what a healthy, orderly rotation looks like: no panic, money calmly changing seats. On the other hand, a fear gauge this low means the market is priced for nothing to go wrong.
Imbalance: a sub-15 VIX is cheap insurance. When protection is this cheap, it’s usually because nobody thinks they need it — which is exactly when the surprise hurts most.
Positioning: low vol isn’t a sell signal; it’s a respect signal. It means the tape is leaning one way and complacent about the other.
Chart of the Week: TSLA Through the Engine
Tesla went into the week coiled under a ceiling near $335 it kept closing beneath. Then CPI day tried to shake everyone out — it flushed to $323.64 intraday before the base held. The very next session it broke the shelf and closed at $339.96, then extended to a $351 high on Friday. Up 4.2% on the week while the indexes barely moved.

Here’s the sequence, run through the Alignment Engine:
1. Bias — a leader coiled under a ceiling. Going in, TSLA was constructive but capped: strong momentum, but stuck under a shelf around $335 it had failed to close above. “Looks ready” is not “is ready.”
2. Key Level — the $335 shelf. One line framed the whole trade: the resistance near $335 that had rejected it repeatedly. Below it, chop. A daily close above it changes the character completely.
3. Reaction — the flush that tested the base. On CPI day the stock dumped to $323.64 intraday — the kind of move that shakes out early longs. But it held the base and closed well off the low. A level that gets tested and refuses to break is getting stronger, not weaker.
4. Confirmation — the break that meant it. The next day TSLA broke the $335 shelf and closed above it at $339.96 — not an intraday poke, a close. Friday it extended to a $351 high. The broken ceiling became the floor. That close-and-hold is the confirmation the Engine waits for.
5. Execution — buy the proven reclaim, not the flush. The qualified trade was never to catch the falling knife on CPI day. It was to let the base prove it would hold, then enter on the daily close back above $335 with risk defined under the $323.64 low. You skipped the scare. You bought the confirmation — and caught the extension.
What the Street Is Buzzing About
While the indexes dozed, single names did the shouting. Reddit (RDDT) ripped ~15% on news it’s joining the S&P 500 (effective Aug 18). Nu Holdings (NU) jumped ~11% on a record quarter and its first billion-dollar profit. SanDisk (SNDK) added ~7% around its Investor Day. The rotation wasn’t just small-caps-over-Dow — it was a tape rewarding specific, provable catalysts.

“The Great Rotation is here. Small caps run for months from here.” After the Russell led to a record, the bull thread called it the start of a durable small-cap leadership cycle — the trade of the second half. The direction is right — leadership did rotate. But “for months” is a story, not a level. One week of small-cap leadership is a rotation; it becomes a trend only if it holds through Wednesday’s Fed minutes and Thursday’s Walmart print. We trade the rotation that’s here, not the one the thread is promising.
“VIX at 14. Nobody’s scared. This is the top.” The bears seized on the sub-15 VIX and record highs, calling complacency the classic pre-drop tell. Low volatility is a real caution — it means no fear is priced in — but “this is the top” is a prediction, not a trade. Markets can stay calm and grind higher for a long time. Shorting record highs on a low VIX alone is how you donate. The trade isn’t to guess the top — it’s to mark the level where the rotation would actually break, and wait for price to lose it.
Inside the Community
Every morning before the bell we run a live pre-market session — walk the indices, mark the levels, build the watchlist, then trade it live. In a week built around a Wednesday CPI print, the room’s edge was patience around the number and precision on the clean single-name levels after it. Nobody pre-positioned for a data point they couldn’t predict.
The setup that kept working was the one the rotation was built for — breakout-and-retest on names with a real catalyst behind them. After CPI cleared, the tape handed the room clean, mechanical levels. Farshad took TSLA long on exactly that break-and-retest into Friday, riding the same reclaim above $335 we walked through in Chart of the Week. The point wasn’t to trade the CPI candle. It was to trade the levels the CPI reaction created.
| Date | Ticker | Setup | Result |
|---|---|---|---|
| Aug 10 | AMD | Break & retest, options long | Loss (−2R) |
| Aug 12 | META | Break & retest, options long | Win (+7R) |
| Aug 13 | SPY | Breakout & retest, options long | Win (+3.3R) |
Three tickets, two green and one red — and the red one is the most instructive of the three. Every entry at a level, every risk defined before the trade, every result reviewed after. Options trades kept to defined risk, no 0/1DTE lottery tickets.
Member spotlight — the journal, not the win. Prashanthi traded independently all week — no signals, no hand-holding — running the same disciplined break-and-retest process. Her week is worth framing because of how it started: Monday, her AMD options break-and-retest stopped out for −2R. A rough open. What she did next is the whole point. She didn’t revenge-trade it. She journaled it — noted the entry was early into the retest, capped her options risk at $45 a trade, and deliberately traded a 5DTE contract instead of chasing a same-day lottery ticket. Thursday, that discipline paid: a clean SPY breakout-and-retest she scaled out of — booking pieces at 2.1R, 3R and 4.9R for a blended +3.3R. Same process, better execution, because she fixed the flaw instead of blaming the market. Green teaches you the setup. Red teaches you the discipline.
The Week Ahead
Data — the Fed does the talking. The week is lighter on top-tier prints but heavy on Fed read-through. It builds to Wednesday’s FOMC minutes, which show the internal debate behind the rate path this rotation is betting on. Housing data peppers Monday and Tuesday, and jobless claims land Thursday.
Earnings — the consumer takes the stand. It’s a retail week. Home Depot (HD) reports Tuesday, Target (TGT) and Lowe’s (LOW) Wednesday, and the headliner — Walmart (WMT) — Thursday. Walmart is the single best read on whether the American consumer is still spending. In a rotation built on the soft-landing bet, that read matters more than any macro number.
One structural note: Reddit (RDDT) officially joins the S&P 500 before Tuesday’s open — expect index-fund flows and volatility around it. And the Jackson Hole symposium looms the following week (Aug 27–29), the next big Fed set-piece. This week’s calm is the setup for that event, not the whole story.

The watchlist — levels we’re marking
| Ticker | Resistance | Support |
|---|---|---|
| SPY | 785 | 770 |
| QQQ | 772 | 755 |
| TSLA | 351 | 333 |
These are lines, not predictions. Define your invalidation before the open and let the reactions come to you. When volatility is this low, patience isn’t passive — it’s the position.
Trade the tell, not the headline.
Want to learn how to read what’s actually moving under a flat index — and trade the level that confirms it, the way the room did with TSLA this week? That’s what we do, live, every session inside the MTC Community. You watch the Alignment Engine run in real time, build the skill, and stop following — start deciding.
Frequently Asked Questions
Why did small caps hit a record high while the Dow fell in August 2026?
In the trading week ending August 14, 2026, a tame July CPI report released Wednesday drained the last of the market’s rate-hike fear. When that fear leaves, capital rotates out of crowded, defensive mega-caps and into small, rate-sensitive companies that benefit most from cheaper money. The Russell 2000 rose 1.1% to a fresh record and led the market, while the blue-chip Dow Jones fell 0.6% — a classic sector rotation hiding beneath a nearly flat S&P 500.
What did the July 2026 CPI report show?
Released Wednesday, August 12, 2026, the July Consumer Price Index rose just 0.1% month-over-month (3.4% year-over-year), with core CPI up 0.2% (2.5% year-over-year). It was a cool, in-line print that confirmed — rather than threatened — the market’s expectation of a September Federal Reserve rate cut, removing the last hawkish risk and triggering the rotation into rate-sensitive names.
What is a market rotation, and why does it matter?
A rotation is when leadership shifts from one part of the market to another — here, from mega-cap technology and defensive names into small caps — often while the headline index barely moves. It matters because a flat index can hide a major repositioning of capital. Traders who watch only the S&P 500 miss the move; traders who watch what’s leading and lagging see the money rotate before the headline catches up.
What is the Alignment Engine?
It’s Meta Trading Club’s framework for qualifying a trade before taking it: bias, key level, reaction, confirmation, execution. The rule is simple — no alignment, no trade. TSLA’s week is a textbook example: it tested a $335 shelf on a CPI-day flush to $323.64, held the base, then closed above $335 at $339.96 — the confirmation the Engine waits for — before extending to a $351 high.
Meta Trading Club provides educational content only. Nothing here is financial, investment, or trading advice, or a recommendation to buy or sell any security. Trading involves substantial risk of loss. Past performance does not guarantee future results.