The Sunday Setup · Week ending July 17, 2026 · ~6 min read
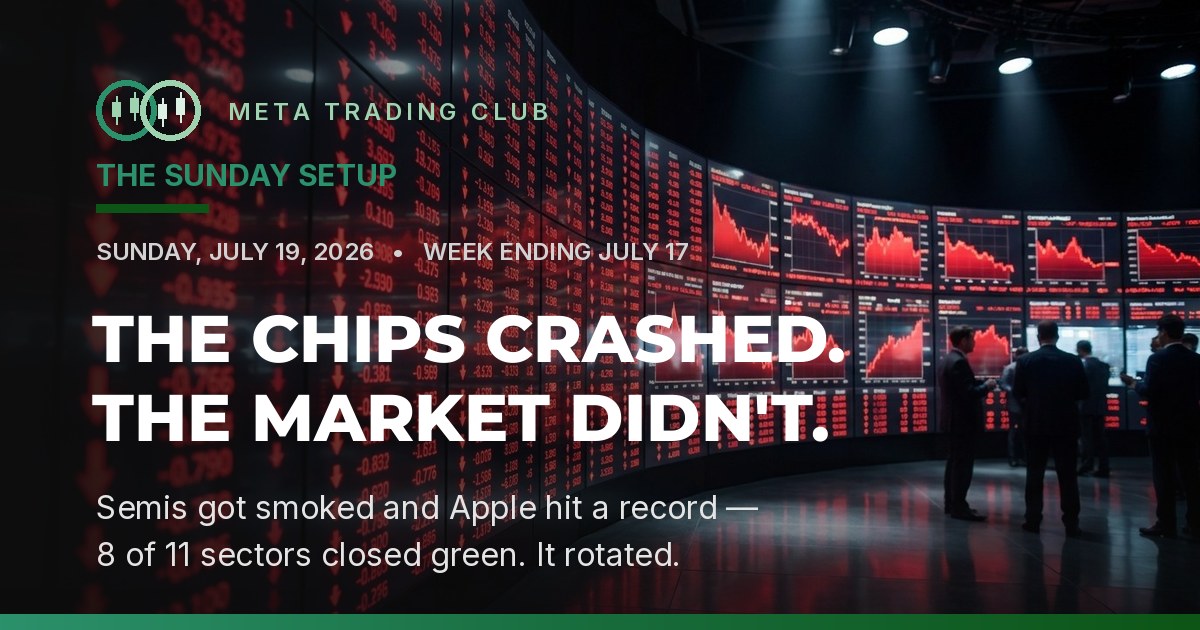
The AI chip selloff was real. Intel fell 13.5%, Micron 13.3%, AMD 11.1%, and the whole semiconductor ETF dropped about 9% on the week. Every headline read the same way: the AI trade is finally breaking.
And yet the market didn’t break with it. Eight of eleven S&P 500 sectors closed green. Apple went out at an all-time high and reclaimed the crown as the most valuable company on earth. The S&P finished the week less than 2% from a record.
That gap is the whole story: when one group breaks, the question isn’t whether the money left — it’s where it went. Here’s the promise for the next six minutes: we’ll break the week down the way we’d break down a single setup — bias, level, reaction — and by the end you’ll know why the “AI top is in” crowd shorted a market that closed near record highs, and why our Chart of the Week was a stand-aside, not a buy.
📊 The Scoreboard
A red week for the indices — but the number on the board hides a leadership handoff.
| Index | Close | Week |
|---|---|---|
| Nasdaq Composite ★ | 25,520.24 | ▼ −2.9% |
| S&P 500 | 7,457.69 | ▼ −1.6% |
| Dow Jones | 52,146.42 | ▼ −0.9% |
| Russell 2000 | 2,962.99 | ▼ −0.9% |
★ The Nasdaq led lower — the mirror image of the prior week, when it led higher. The same crowded names drove both moves. The Nasdaq fell three times harder than the Dow, and that gap is the rotation.

Read the internals, not the headline number. The average on the board says risk-off. The sector map says something else entirely.

Apple was the only green mega-cap, up 2.4% to a record. Nvidia, Broadcom, AMD, Micron and Intel led the flush — the whole move concentrated in the chip complex.

Where the money flowed tells the real story: energy led, and eight of eleven sectors finished green. Only technology took a real hit.

🔍 Decoded: The Two That Actually Matter
1. The chips took the hit — and it landed late
Four quiet days, then Thursday two AI worries hit at once. A marquee foundry guided its capital spending sharply higher — the market read it as “peak AI spending.” At the same time, a cheap new open-source model revived the fear that AI margins are a mirage. The most crowded trade on the board unwound in two sessions: Intel −13.5%, Micron −13.3%, AMD −11.1%, the chip ETF down about 9%.
Imbalance: semiconductors were the most crowded trade on the board — one whiff of doubt forced the exit.
Positioning: the selling stayed inside the chip complex. That’s an unwind, not a top.
This is the read that saved you money this week. “AI selloff” was the headline; the tape said something narrower — one over-owned group getting flushed while the rest of the market held its ground. The reaction did the talking, and the reaction stayed contained.
2. The money rotated — it didn’t leave
While the chips bled, Apple closed at an all-time high and retook the most-valuable-company crown. Energy, staples, utilities and financials all finished green. Eight of eleven sectors up, on a week the Nasdaq fell 2.9%. That’s a leadership handoff, not a market top.

Imbalance: the un-crowded sectors had room to run because nobody was chasing them.
Positioning: Apple at a record while chips broke is the cleanest read on the week — strength is rotating, not disappearing.
📈 Chart of the Week: NVDA Through the Engine
A week ago, Nvidia was the tell — the one name that refused to break with its group. This week it was the tell again, in the opposite direction. Wednesday it poked to a marginal new high near $212.50 and couldn’t hold it — no volume, the group already wobbling. Thursday and Friday’s AI scare knocked it back to $202.81, right onto the $200 line it had reclaimed a week earlier. A failed breakout, textbook.

Here’s the sequence, run through the Alignment Engine:
1. Bias — leadership was already fading. The general stood but the army was retreating. When the group is weak and the leader is stretched, you lower conviction on longs, not raise it.
2. Key Level — $210 above, $200 below. The breakout line overhead, the reclaimed shelf underneath. The whole trade lived between them.
3. Reaction — the new high came on lighter volume with the group weak. A breakout the tape won’t confirm is a trap. The reaction was telling you not to trust the print.
4. Confirmation — it failed the way failed breakouts fail. Thursday and Friday lost $210, then $205, and closed at $202.81 back on the $200 line — sector aligned lower. The failed breakout was confirmed by a hard rejection.
5. Execution — no long here. A new high on no volume into a weak group is a fade, not a buy. Stand aside, or short the rejection under $210 with defined risk. Same stock, same Engine as last week — the answer just flipped.
💬 What the Street Is Buzzing About
The chip damage split the timelines again. One camp called the AI top. The other called the broadening rally the most bullish thing possible. Both were loud. Neither was a trade by itself.

🧊 “This is it — the AI top is finally in.” The chip damage is real, and a crowded trade getting flushed is a genuine warning. But a top isn’t a top when eight sectors close green and the S&P sits 2% off a record. “The top is in” is a prediction, not a level. Watch whether the selling spreads — so far it hasn’t. You don’t short a market on a vibe while most of it is holding.
🔥 “Broadening rally — the most bullish thing possible.” Mostly right — a broadening tape is healthy, and rotation into value and defensives is what a durable market does. But “bullish” still isn’t an entry. Buy the strength at a level you can define risk against, not because a chart went green.
🤝 Inside the Community
Every morning before the bell we run a live pre-market session — walk the indices, mark the levels, build the watchlist, then trade it live. In a rotation week, the room’s edge was simple: don’t marry the leaders. When the chips lost their level, the play wasn’t to defend them — it was to follow the strength into what was actually working.
The teaching moment came pre-market, from Saurabh’s AAPL long. With everyone fixated on the AI names, he flagged the un-obvious tell — Apple quietly making higher lows while its sector-mates rolled over. When the leader breaks, don’t stare at the wreck; scan for what’s holding. That’s the whole rotation playbook in one read.
| Date | Ticker | Setup | Result |
|---|---|---|---|
| Jul 14 | QQQ | Rejection at resistance, short (puts) | Win |
| Jul 15 | AAPL | Relative-strength breakout, long (calls) | Win |
Two tickets, both green — and notice the sides. Short the crowded index into resistance, long the name showing real relative strength. Same week, opposite direction, same rule: trade the level in front of you, not the story you walked in with.
👤 Member spotlight — Prashanthi. She took the QQQ short Tuesday as the index stalled at resistance with chips leading lower. The standout wasn’t the win — it was the risk. She capped it at a defined $50 max loss, sized to be wrong without it stinging, and let the level do the work. That process compounds, green or red. The size is small on purpose; the discipline is the point.
📅 The Week Ahead
Earnings: Alphabet and Tesla report Wednesday — the first mega-cap read on whether the AI-spending story that spooked the chips actually shows up in the numbers. Intel reports Thursday, straight into its worst week in ages.
Fed: the FOMC is in its blackout window ahead of the July 28–29 meeting — no Fed-speak. Price trades on earnings and rotation, not headlines from officials.

The watchlist — levels we’re marking
| Ticker | Resistance | Support |
|---|---|---|
| NVDA | 210 | 200 |
| AAPL | 340 | 325 |
| QQQ | 725 | 700 |
| SPY | 752 | 738 |
The real question: does the rotation hold, or does the selling spread? If money keeps flowing into the green sectors while chips stabilize, the handoff is healthy. If the broad market follows semis lower, it stops being a rotation and becomes risk-off. Watch the reaction, not the next red candle. Define your invalidation before the open.
Trade the level, not the headline.
Want to learn to read rotation and qualify setups like the NVDA failed breakout yourself? That’s what we do, live, every session inside the MTC Community. You watch the Engine run in real time, build the skill, and stop following — start deciding.
Frequently Asked Questions
Why did semiconductor stocks sell off the week of July 17, 2026?
Two AI worries hit at once on Thursday: a major foundry guided capital spending sharply higher, which the market read as a peak in AI spending, and a cheap new open-source model revived fears about AI profit margins. The most crowded trade on the board unwound fast — Intel fell about 13.5%, Micron 13.3% and AMD 11.1%, with the semiconductor ETF down roughly 9% on the week.
If the chips crashed, why did the S&P 500 hold up?
The selling stayed inside the semiconductor complex while money rotated into other sectors. Eight of eleven S&P 500 sectors closed green, led by energy, and Apple hit an all-time high to reclaim the title of most valuable company. That is a leadership handoff, or sector rotation — not a broad market top.
What is sector rotation, and why does it matter?
Sector rotation is money moving out of one group of stocks and into another, rather than leaving the market entirely. It matters because a selloff concentrated in one crowded sector can look like a crash if you only watch that sector — while the broader market stays healthy. Reading the tape sector by sector tells you whether strength is disappearing or just changing seats.
What is the Alignment Engine?
It’s Meta Trading Club’s framework for qualifying a trade before taking it: bias, key level, reaction, confirmation, execution. The rule is simple — no alignment, no trade. It’s designed to keep you from trading headlines and get you trading how price actually reacts at a level.
Meta Trading Club provides educational content only. Nothing here is financial, investment, or trading advice, or a recommendation to buy or sell any security. Trading involves substantial risk of loss. Past performance does not guarantee future results.