The Sunday Setup · Week ending August 7, 2026 · ~6 min read
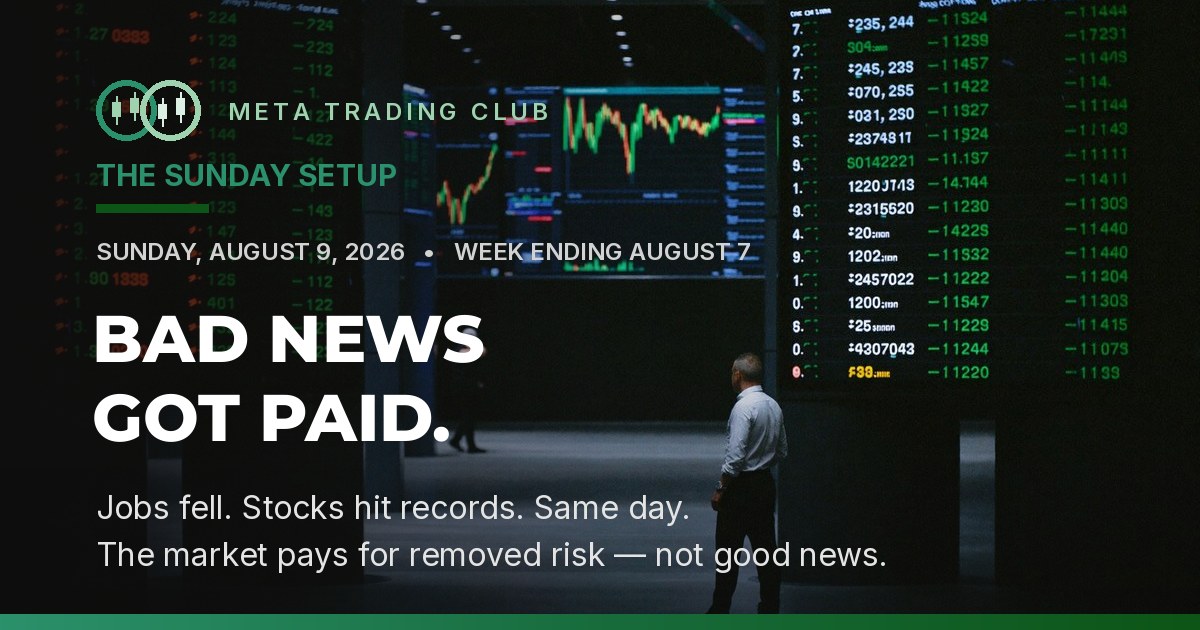
Last week the whole tape was bracing for one thing: a hot jobs number that would keep the Fed hawks loud and push rate cuts further out of reach. Friday morning we got the opposite — and the market did the thing that confuses most people every time it happens. It ripped.
The July jobs report was ugly. The economy lost 23,000 jobs against expectations of a +83,000 gain, and the prior two months were revised down by another 103,000. On the surface, that’s a growth scare. And yet the S&P 500 and the Nasdaq both closed the week at record highs, posting their best week since April. Bad economic news. All-time highs. Same day.
Here’s the shift, and it’s the whole story in one line: the market doesn’t pay for good news — it pays for removed risk. A weak jobs print didn’t scare this tape. It freed it. It took the last hawkish fear off the table, put a September rate cut firmly back in play, and the market re-priced instantly. Here’s the promise for the next six minutes: we’ll break the week down the way we’d break down a single setup, and by the end you’ll understand exactly why the worst payrolls number in years sent stocks to record highs.
The Scoreboard
Green across the board — and unlike the narrow weeks that came before it, this one was broad. Both headline indexes closed at records, and the small caps came right along with them.
| Index | Close | Week |
|---|---|---|
| Nasdaq Composite ★ | 26,690.62 | ▲ +5.2% |
| S&P 500 ★ | 7,757.64 | ▲ +3.6% |
| Russell 2000 | 3,034.49 | ▲ +3.5% |
| Dow Jones | 54,036.93 | ▲ +3.0% |
★ Record closes for both the S&P 500 and the Nasdaq — and every one of the four major indexes closed up more than 2.9%.

When small caps rally with big tech, that’s not a narrow melt-up. That’s a rate-relief trade. Last week the tape was sorting — rewarding proven winners, punishing the rest. This week it did the opposite: it bought almost everything. The difference was the catalyst. Earnings sort names one by one. A macro shift — and a weak jobs report that reprices the entire rate path is a macro shift — lifts the whole boat at once.

Read the catalyst. That’s why “bad” data got bought. When the fear is rates, weak growth isn’t a threat — it’s the relief. The market wasn’t celebrating a shrinking economy. It was celebrating the removal of the one thing standing between it and cheaper money.
Decoded: The Two That Actually Matter
1. The market repriced the Fed, not the economy
The jobs report wasn’t a small miss — it was a shock. The Street expected roughly +83,000 new jobs. Instead the economy shed 23,000, and revisions erased another 103,000 from May and June. Unemployment ticked to 4.1%. A month ago, a print like that would have triggered a recession scare. This week it triggered a rally.

Imbalance: the tape was positioned for “higher for longer.” A weak jobs report forces a re-pricing. Overnight, a September cut went from possible to expected, and every rate-sensitive corner of the market caught a bid at once.
Positioning: the tell was what led. Small caps and rate-sensitive names ripped alongside tech. That’s not a growth rally — a growth rally leaves the weak economy’s losers behind. This was a rate rally: cheaper money lifts the whole board.
The lesson hiding in the numbers: the same data point means opposite things depending on what the market is afraid of. When the fear is inflation and rates, weak growth is good news — it removes the reason to stay hawkish. Read the fear first. The data only matters relative to what the tape was already braced for.
2. Breadth came back — and that changes the tape
For months this rally has been narrow — a handful of mega-caps carrying tired indexes. This week the Russell 2000 rose 3.5%, almost matching the Nasdaq, and closed in on its own record. When the smallest, most rate-sensitive companies rally as hard as the giants, the market is telling you the relief is broad, not concentrated.

Imbalance: a narrow rally is fragile; a broad one is durable. Money moving out the risk curve into small caps is a sign of conviction.
Positioning: the risk is that it’s a one-week reflex to a single number. Broad participation has to hold to matter. One green week isn’t a trend — but it’s the first thing a real one needs.
Chart of the Week: AMZN Through the Engine
Amazon reported the prior week and gapped up roughly 4.7% to open the month at a record — crossing $3 trillion in market value for the first time on the back of accelerating AWS growth. Then, instead of fading, it held the breakout and closed green every single session into Friday’s rally. A textbook confirmed break.

Here’s the sequence, run through the Alignment Engine:
1. Bias — a leader coiled under a ceiling. Going in, AMZN was constructive but capped: great business, strong cloud momentum, but stuck under a shelf in the low $270s it had failed to clear for weeks. “Looks ready” is not “is ready.”
2. Key Level — the ~$274 shelf. One line framed the whole trade: the resistance around $274 that had rejected the stock repeatedly. Below it, chop. A daily close above it, on a catalyst, changes the character completely.
3. Reaction — the gap that meant it. AWS growth reaccelerated and the stock gapped ~4.7% straight through the shelf to a record, tagging the $3T mark. A level that breaks on a gap, on volume, with a real fundamental behind it, is a level that means it.
4. Confirmation — it held and extended. It didn’t fill the gap. It closed green every day for the rest of the week, riding the Friday rate-relief rally to new highs. The broken ceiling became the floor. That hold is the confirmation the Engine waits for.
5. Execution — buy the proven break, not the earnings guess. The qualified trade was never to gamble a long into the print. It was to let AMZN prove the reclaim above $274 and hold it, then enter with risk defined under the breakout. You gave up the first candle of the gap. You kept your capital off a coin flip and still caught a re-rated leader all the way up.
What the Street Is Buzzing About
The jobs report split the timelines instantly. Half the feed read a negative payrolls print as the start of a recession; the other half called it the “green light” for cuts and piled into risk. Same number, two opposite trades — screamed with equal confidence.

“The cut is locked. New highs are just the start.” After the records printed, the bull thread flipped to extremely bullish and message volume spiked, calling a straight line to a September cut and beyond. The direction is right — the rate path did shift. But “locked” is the word that gets people hurt. The market has fully priced a cut; that means all the good news is in. One hot inflation number Wednesday and this thread reverses. We’re long the trend, not the certainty.
“Jobs are cratering. This is a bull trap before the recession.” The bears seized on the negative print and the downward revisions, calling the record close a classic top. The concern isn’t crazy — a weakening labor market is a real risk if it keeps sliding. But “bull trap” is a prediction, not a trade. The tape closed at highs, not lows. Shorting a record on a feeling is how you donate. The trade isn’t to guess the top — it’s to mark the level where the rally would actually break, and wait for price to lose it.
Inside the Community
Every morning before the bell we run a live pre-market session — walk the indices, mark the levels, build the watchlist, then trade it live. In a week that ran into a market-moving jobs print, the room’s edge was where it traded: the readable index and single-name levels before Friday, and patience around the number itself. Nobody pre-positioned for a data point they couldn’t predict.
The setup that kept working was the same one all week — breakdown-and-retest and clean reversals on QQQ and SPY. Tuesday and Wednesday, before the jobs risk, the indices handed the room mechanical levels. Then on Thursday, MU broke and retested a level cleanly for a member long. The point wasn’t to catch the whole rally. It was to take the trades that were actually readable.
| Date | Ticker | Setup | Result |
|---|---|---|---|
| Aug 5 | SPY | Breakdown & retest, short | Win (+2.0R) |
| Aug 5 | QQQ | Break & retest of PMH, long | Loss (−1R) |
| Aug 6 | QQQ | Reversal / B&R, PML & VWAP | Win (+2.1R) |
| Aug 6 | MSFT | Breakout & retest, long | Win (small) |
| Aug 7 | MU | Break & retest, long | Win (+1.9R) |
| Aug 7 | SPY | Reversal, short | Loss (−1R) |
| Aug 7 | QQQ | Reversal, short | Loss (−1R) |
Seven tickets, four green and three red — and Friday’s three are the ones worth studying. Fighting a record-day rally with reversal shorts is hard; the log shows it honestly. Every entry at a level, every risk defined before the trade, every result reviewed after.
Member spotlight — the journal, not the win. Prashanthi traded independently all week again — no signals, no hand-holding — running the same disciplined break-and-retest process across four sessions. She logged her winners (SPY +2.0R, QQQ +2.1R, MU +1.9R) and her losers with the same detail. But the ticket worth framing isn’t a green one. Friday, fighting the rally, her QQQ reversal short stopped out for −1R. Her journal note is the whole lesson: “Trade idea was still valid — price hit my stop, then went to my target. Maybe a wider stop next time.” She didn’t call the idea wrong. She caught that her risk placement was the flaw, not her read. That’s a trader diagnosing her own process instead of blaming the market. Green teaches you the setup. Red teaches you the discipline.
The Week Ahead
Data — it’s an inflation week. The jobs report gave the Fed room to cut. Now the market needs inflation to cooperate. The calendar builds to Wednesday: CPI is the number that either confirms the September cut or kills it. PPI follows Thursday, and Retail Sales Friday tells us whether the consumer is actually slowing. A cool CPI and this rally has legs. A hot one and Friday’s records get tested fast.
Earnings: the mega-cap wave is done, but the second tier keeps reporting — Cisco (CSCO) headlines a lighter week. With the macro doing the heavy lifting, individual reports matter less than the read-through on enterprise and consumer demand.
The rate bet is the whole market now: after Friday, a September cut is nearly fully priced. That’s a double-edged setup — the good news is in, which means the risk is asymmetric. If CPI runs hot, there’s a lot of priced-in optimism to unwind.

The watchlist — levels we’re marking
| Ticker | Resistance | Support |
|---|---|---|
| SPY | 785 | 770 |
| QQQ | 770 | 748 |
| AMZN | 300 | 278 |
| MSFT | 480 | 460 |
The real question: does the soft-landing trade — weak jobs, cooling inflation, coming cuts — hold together, or does one hot print crack it? Define your invalidation before the open, and let the reactions come to you. In a CPI week, patience isn’t passive — it’s the position.
Trade the level, not the headline.
Want to learn how to read what the tape is actually afraid of — and trade the level that removes the risk, the way the room did with AMZN and the index setups this week? That’s what we do, live, every session inside the MTC Community. You watch the Alignment Engine run in real time, build the skill, and stop following — start deciding.
Frequently Asked Questions
Why did the stock market hit record highs on a weak jobs report in August 2026?
On August 7, 2026, the July jobs report showed the economy lost 23,000 jobs versus expectations of a +83,000 gain, with 103,000 jobs revised away from prior months. Rather than a growth scare, the market read the weak data as removing the last obstacle to a Federal Reserve rate cut. Odds of a September cut jumped to near-certain, and the S&P 500 and Nasdaq both closed at record highs — because the tape had been fearing a hawkish Fed, and the report removed that fear.
What did the July 2026 jobs report show?
Nonfarm payrolls fell by about 23,000 in July 2026 against expectations of a roughly +83,000 gain, and revisions cut another 103,000 jobs from May and June. The unemployment rate ticked up to 4.1%. It was one of the weakest payrolls prints in years, and it repriced the market’s rate-cut expectations sharply higher.
Why did Amazon stock cross $3 trillion in 2026?
Amazon gapped up roughly 4.7% to a record after AWS cloud revenue growth reaccelerated, pushing its market value above $3 trillion for the first time. The move cleared a resistance shelf near $274 that had capped the stock for weeks, and Amazon then held the breakout and closed green every session into the following week’s rally — a confirmed break rather than a one-day pop.
What is the Alignment Engine?
It’s Meta Trading Club’s framework for qualifying a trade before taking it: bias, key level, reaction, confirmation, execution. The rule is simple — no alignment, no trade. It’s designed to keep you from trading headlines and get you trading how price actually reacts at a level, the way Amazon’s confirmed breakout above $274 rewarded patience this week.
Meta Trading Club provides educational content only. Nothing here is financial, investment, or trading advice, or a recommendation to buy or sell any security. Trading involves substantial risk of loss. Past performance does not guarantee future results.