Wednesday, July 8, 2026 · 4:30 PM ET · MTC Market Close
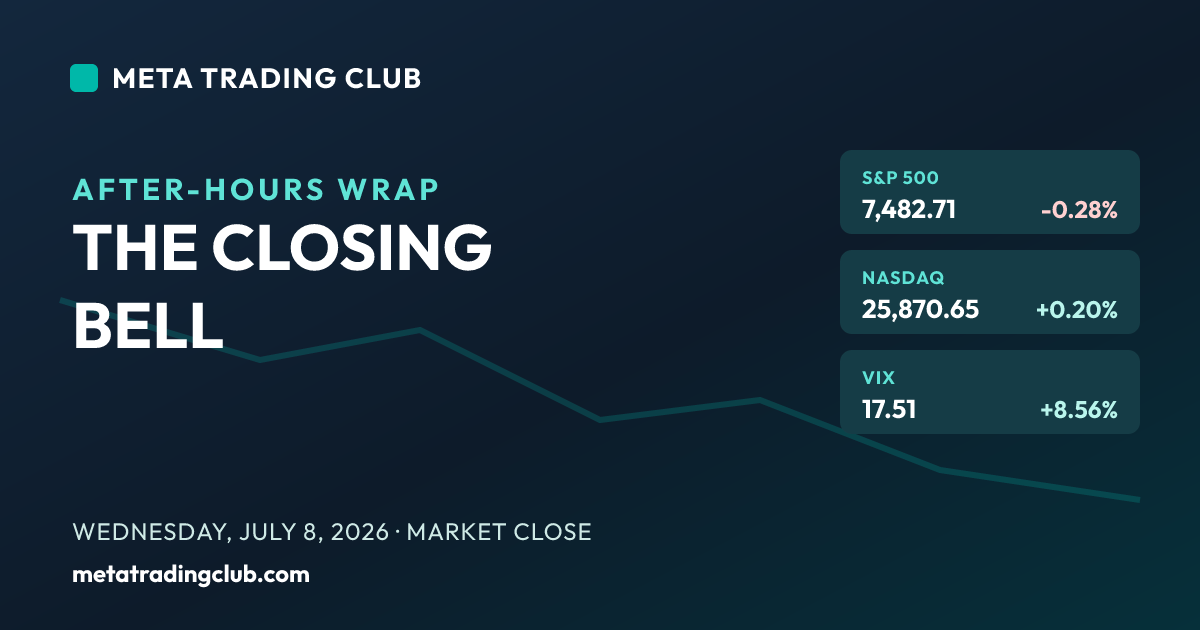
The tape that reclaimed 7,500 on Monday spent Wednesday giving it all back, and the catalyst came from outside the market entirely. Late Tuesday, US forces struck Iran in response to attacks on commercial vessels in the Strait of Hormuz; on Wednesday President Trump said the interim deal was ‘over’ and the Treasury revoked the waiver that had let Iran sell crude globally. Oil did the rest. WTI surged $3.60 (+5.1%) to $74.04 and Brent jumped to $78.10 — an instant repricing of the inflation and supply risk that bled straight into the fuel-sensitive parts of the market. The Dow paid for it, falling 576.76 points (-1.09%) to 52,348.39 as airlines got crushed: American -5%, United -4%, Delta and JetBlue each about -3%. The S&P 500 slipped 0.28% to 7,482.71, surrendering the 7,500 shelf it had just reclaimed. And yet the Nasdaq closed green, up 0.20% to 25,870.65 — a handful of megacap tech names steadied enough to keep the index positive against a broadly lower tape. That split is the whole story: Dow down 577, Russell -0.30%, but Nasdaq up. Energy was the only sector clearly higher — ConocoPhillips +2.2%, Chevron +1.9%, Exxon +1.6% — while the VIX jumped 8.56% to 17.51 as the fear gauge finally woke up. At 2 PM the June FOMC minutes landed, and they leaned hawkish: nine of nineteen participants projected at least one more hike this year, and new Chair Kevin Warsh became the first chair since 2012 to submit no dot-plot projection. Rising oil plus a hawkish Fed is the worst possible combination for the rate-cut hopes still priced into this market — gold fell more than 1% to about $4,050 and the 10-year held near 4.50%, a two-week high, on that exact fear. Tomorrow, PepsiCo opens Q2 earnings season before the bell and jobless claims land in the morning. The read is clean: when the Dow dumps, breadth rolls over, and the VIX spikes while one index prints green, the move isn’t confirmed. No alignment, no trade.
The Closing Bell
| Instrument | Close | Change | Note |
|---|---|---|---|
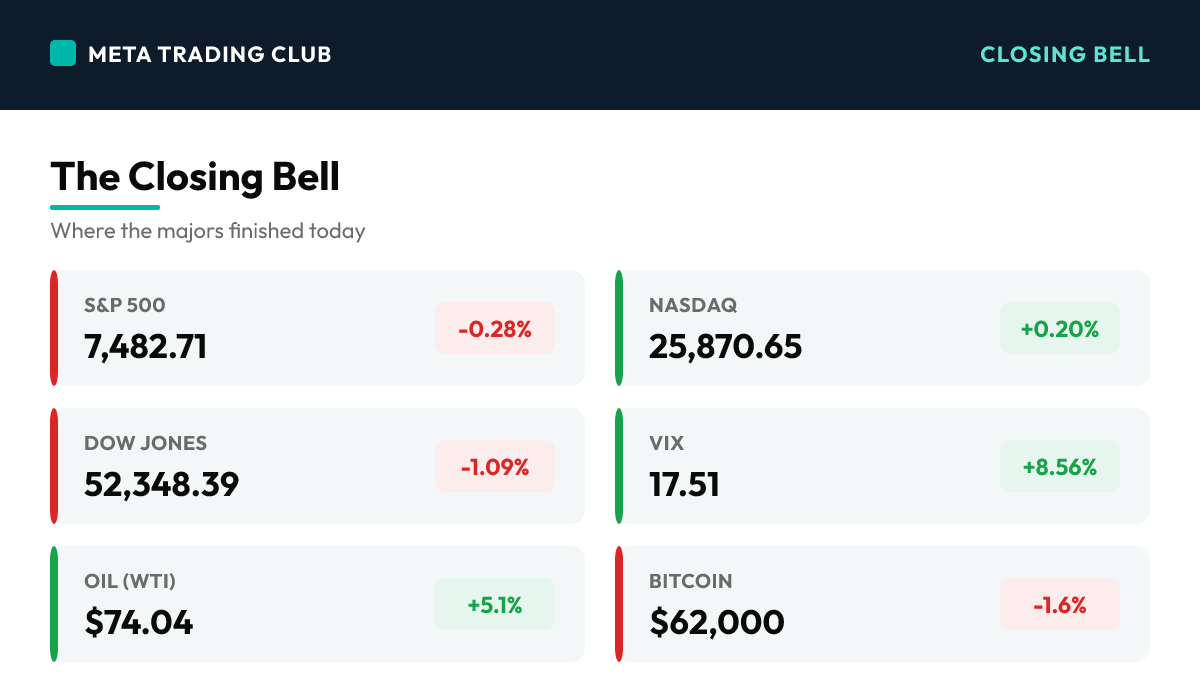
| S&P 500 | 7,482.71 | -0.28% | Slipped back below the 7,500 shelf it reclaimed Monday as the Iran oil shock and a hawkish Fed read pressured the tape — a quiet-looking headline hiding a split market underneath |
| Nasdaq | 25,870.65 | +0.20% | The lone green index — a handful of megacap tech names steadied after two rough sessions, but the gain came against a broadly lower tape and heavy semis |
| Dow Jones | 52,348.39 | -1.09% | Fell 577 points as airlines, industrials and fuel-sensitive names sank under a 5%-plus oil surge — the clearest sign of where the day’s damage actually landed |
| Russell 2000 | 3,015.34 | -0.30% | Small caps slipped with the broad tape; held above 3,000 but offered no leadership as risk came off across cyclicals |
| VIX | 17.51 | +8.56% | Jumped nearly 9% off the mid-15s — the fear gauge finally woke up as the Middle East escalation and hawkish minutes hit within hours of each other |
| 10-Yr Yield | 4.50% | flat | Held near 4.5%, its highest in two weeks, as the oil spike revived inflation worry and the June minutes leaned hawkish — a headwind for rate-cut hopes |
| Gold | $4,050.00 | -1.2% | Fell more than 1% to its lowest since July 2 — higher-for-longer rate fears from the oil-driven inflation scare outweighed the usual safe-haven bid |
| Oil (WTI) | $74.04 | +5.1% | Surged $3.60 after the US struck Iran and Treasury revoked its oil-export waiver; Brent jumped to $78.10 — the single central catalyst of the session |
| Bitcoin | $62,000 | -1.6% | Slid with risk assets after the strikes, giving back ground as a leveraged-money flush met the oil shock and the broad de-risking tone |
Today’s Charts
Daily candlestick charts with 20/50/200-day moving averages — the index majors, the day’s biggest mover on each side, and the leading sector ETF.

Charts: Finviz (daily). Levels and overlays update through the next session.
Sector Scoreboard
What Drove The Day
Wednesday was a geopolitics day, and the market traded like one. The setup came in overnight: late Tuesday, US forces carried out air strikes against Iran in response to attacks on three commercial vessels in the Strait of Hormuz. By Wednesday morning, President Trump said the interim agreement with Iran was ‘over’ — while leaving the door open to more talks — and the Treasury revoked the waiver that had allowed Iran to sell oil on global markets. The energy tape did the rest. West Texas Intermediate surged $3.60, or 5.1%, to $74.04, and Brent jumped $3.94 to $78.10, pricing in supply-disruption risk in an instant. That single move rewired the whole session. Fuel-sensitive names got hit immediately — American Airlines fell about 5%, United dropped 4%, and Delta and JetBlue each slid roughly 3% as the math on jet fuel flipped against them. The Dow, heavy with industrials and travel exposure, fell 576.76 points (-1.09%) to 52,348.39, one day after briefly tapping a record. The S&P 500 slipped 0.28% to 7,482.71, surrendering the 7,500 level it had just reclaimed on Monday. But the Nasdaq refused to follow, closing up 0.20% at 25,870.65 as a few steadying megacaps offset the broad weakness. That divergence — Dow down 577, Russell 2000 off 0.30% to 3,015.34, and Nasdaq green — is the tell of the day. Energy was the only sector clearly in the green: ConocoPhillips +2.2%, Chevron +1.9%, Exxon Mobil +1.6%. The VIX jumped 8.56% to 17.51, its first real move in weeks. Then at 2 PM ET the June FOMC minutes landed, and they leaned hawkish: nine of nineteen participants projected at least one more rate hike before year-end, and new Chair Kevin Warsh became the first chair since the dot plot launched in 2012 to submit no projection of his own. Coming on the same day as a 5% oil spike, that read is toxic for rate-cut hopes — gold fell more than 1% to about $4,050, its lowest since July 2, and the 10-year Treasury held near 4.50%, a two-week high, both trading the higher-for-longer inflation fear. Bitcoin slid toward $62,000 as the risk-off tone and a leveraged-money flush hit crypto. Into tomorrow, PepsiCo opens Q2 earnings season before the bell — with several analysts having trimmed targets into the print — and initial jobless claims arrive in the morning. The lesson is the one the tape kept repeating: one index printed green, but the Dow dumped, breadth rolled over, and the fear gauge spiked. When price, breadth and volatility disagree, the move isn’t confirmed. No alignment, no trade.
MAJOR HEADLINES AND CATALYSTS
Top Market-Moving Stories
- OIL SHOCK — US STRIKES IRAN, TRUMP SAYS DEAL IS ‘OVER,’ CRUDE SURGES 5%+ (Day) — After US forces struck Iran late Tuesday over Strait of Hormuz vessel attacks, President Trump said the interim deal was ‘over’ and the Treasury revoked Iran’s oil-export waiver. WTI jumped 5.1% to $74.04 and Brent to $78.10, sending energy up and fuel-sensitive names down hard.
- DOW DUMPS 577, S&P LOSES 7,500 — BUT THE NASDAQ CLOSES GREEN (Day) — A split tape: the Dow fell 1.09% to 52,348, the S&P slipped 0.28% back under 7,500 to 7,482.71, yet the Nasdaq rose 0.20% to 25,870 as a few megacaps held. The VIX jumped 8.56% to 17.51. The index screens disagreed all day — a classic no-alignment session.
- FED MINUTES LEAN HAWKISH — 9 OF 19 SEE ANOTHER HIKE (Day) — The June 16-17 minutes showed a more hawkish committee than expected: nine of nineteen participants projected at least one more hike in 2026, and new Chair Warsh withheld his own dot-plot projection. Rising oil plus a hawkish Fed squeezed the rate-cut hopes still priced in.
Fed and Macro Context
- The June FOMC minutes, released at 2 PM ET, confirmed a hawkish hold at 3.50-3.75%. Nine of nineteen participants projected at least one hike before year-end, and Chair Kevin Warsh became the first chair since 2012 to submit no dot-plot projection — a deliberate signal that the Fed is moving away from traditional forward guidance.
- The oil surge revived the inflation channel directly: the 10-year Treasury held near 4.50%, a two-week high, and gold fell more than 1% to about $4,050 as higher-for-longer regained control of the narrative on the same afternoon the minutes landed.
- Cross-asset, risk came off everywhere except energy: the VIX rose 8.56% to 17.51, WTI jumped 5.1% to $74.04, Brent hit $78.10, and Bitcoin slid toward $62,000 as the de-risking swept through crypto.
Single-Stock Standouts
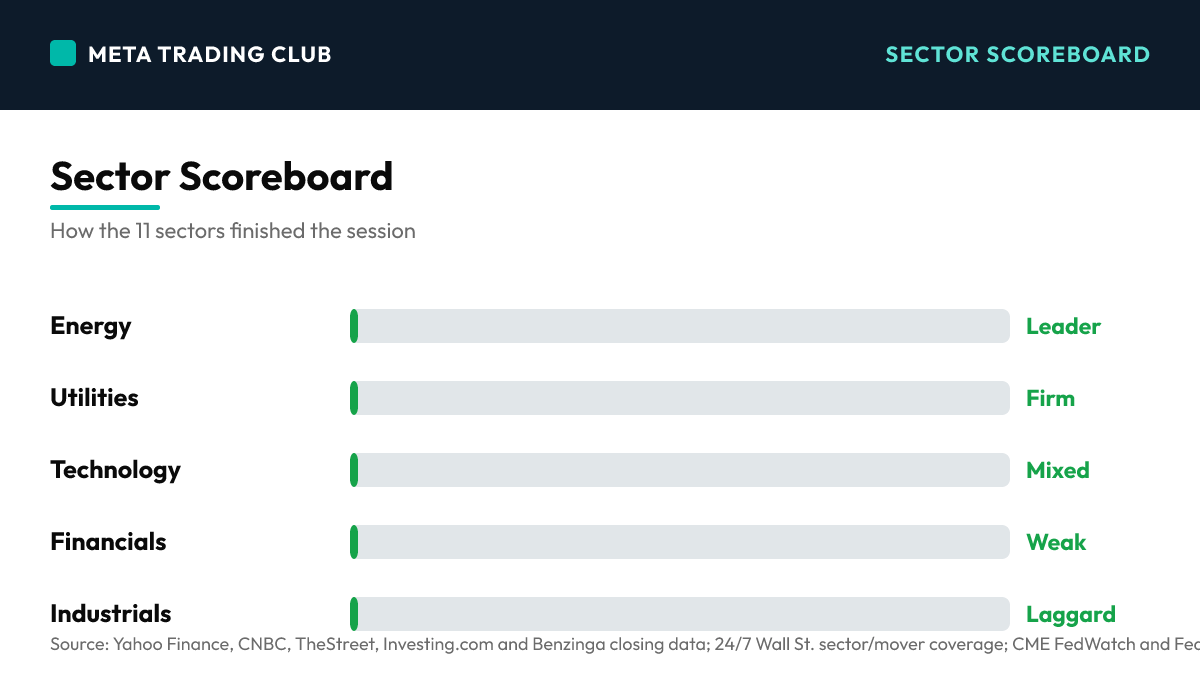
- Energy was the day’s safe harbor: ConocoPhillips +2.2%, Chevron +1.9%, and Exxon Mobil +1.6% as the crude spike lifted the integrated majors — among the only green large caps on the board.
- Airlines took the direct hit: American Airlines about -5%, United -4%, and Delta and JetBlue each roughly -3%. A 5% oil move flips the jet-fuel math instantly, and the market repriced the whole group in a session.
- SpaceX fell about 6.8% below its IPO price as its Nasdaq-100 inclusion let early investors offload shares into the passive index bid — a reminder that mechanical inclusion cuts both ways once the buying is done.
AFTER-HOURS EARNINGS SPOTLIGHT
Tonight’s Slate
- A light post-close slate — no major after-hours reports tonight. The real earnings catalyst is tomorrow’s premarket, when PepsiCo (PEP) reports before the open as the unofficial kickoff to Q2 season, with the conference call at 8:15 AM ET and EPS estimated near $2.19.
- Several Wall Street analysts trimmed their PepsiCo price targets into the print, so the result is an early read on consumer spending power with prices still elevated. Delta Air Lines reports Friday and Levi Strauss later in the week — the season builds from here.
NEXT SESSION SETUP
Thursday, July 9 — PepsiCo Kicks Off Q2 Earnings
- PepsiCo reports before Thursday’s open (call 8:15 AM ET, EPS est ~$2.19) — the unofficial start of Q2 earnings season and an early tell on the consumer, made sharper by the fact that several analysts cut their targets into the print.
- Initial jobless claims and June existing home sales land Thursday morning — the labor read matters more than usual with the Fed leaning hawkish and markets re-pricing the July 29 hike odds higher on the oil-inflation scare.
- Iran headlines stay the wild card: Trump said strikes ‘could continue’ while leaving talks open. Any escalation keeps crude bid and pressures the fuel-sensitive complex — energy stays the single cleanest tell for the tape.
Winners & Losers
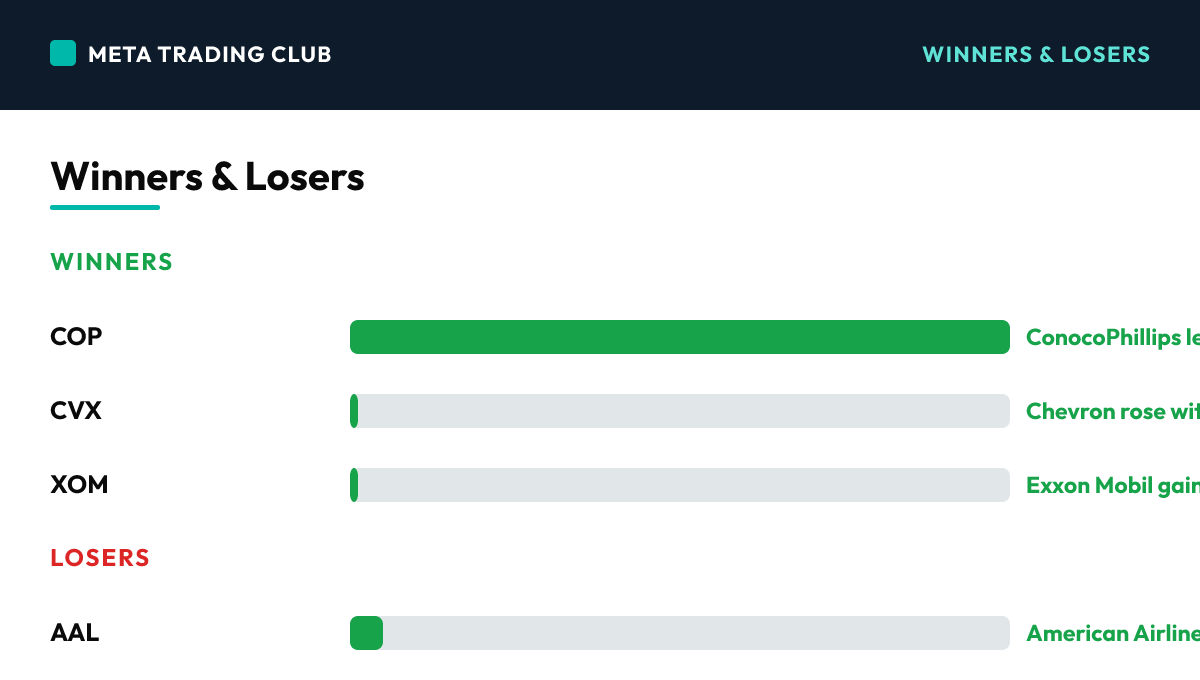
Winners
| COP | +2.2% | ConocoPhillips led the energy bid as WTI surged over 5% to $74 on the Iran strikes and the revoked oil-export waiver | |
| CVX | +1.9% | Chevron rose with the crude spike — integrated oil majors were among the very few green large caps on the day | |
| XOM | +1.6% | Exxon Mobil gained as the oil complex rallied on Middle East supply-disruption fears after the US escalation |
Losers
| AAL | -5.0% | American Airlines sank the most among carriers as WTI’s 5%-plus jump to $74 threatened fuel costs — the clearest oil-shock casualty of the session | |
| UAL | -4.0% | United Airlines fell 4% alongside the airline complex; Delta and JetBlue each dropped about 3% on the same fuel-cost fear | |
| SPCX | -6.8% | SpaceX slid below its IPO price as Nasdaq-100 inclusion let early investors offload shares into the passive index bid |
What It Sets Up For Tomorrow
Levels Into Tomorrow
- S&P 500 7,500 — THE PIVOT, LOST FROM ABOVE. Reclaimed Monday, surrendered today with a 7,482 close. Recover and hold 7,500 Thursday and the dip reads as an oil-headline shakeout; stay below and the sellers keep control of the tape.
- S&P 500 7,540 — the reclaim-and-rejection shelf from this week’s highs. Getting back above it would put the record chase toward the 7,610 zone back on the table.
- S&P 500 7,400 — lose the 7,480 area and this is the next real support. A break here turns a one-day oil scare into a genuine trend change rather than a headline blip.
Bull case: The Iran shock proves a one-day repricing, crude cools back off $74, and the Nasdaq’s green close is the tell — tech leadership steadies, the S&P reclaims 7,500 as support, PepsiCo opens earnings season cleanly, and the dip gets bought back toward the week’s highs.
Bear case: The oil surge sticks, the hawkish minutes and a 4.5% 10-year keep the pressure on, airlines and cyclicals stay heavy, and the S&P loses the 7,480 shelf toward 7,400 as the VIX’s near-9% jump proves the start of a real risk-off leg rather than a blip.
What We’re Watching
- Crude oil — does WTI hold above $74 or fade the spike? Energy is the single cleanest tell for whether the risk-off tone extends into Thursday.
- The VIX at 17.51 after a near-9% jump — a further push toward 20 confirms fear is spreading; a fade back under 16 says the shock was a one-day event.
- PepsiCo earnings and jobless claims Thursday morning — the first micro and macro reads of the new session, and the tells for whether the tape stabilizes or the selling continues.
Risks Into Tomorrow
- Geopolitical oil shock — US strikes on Iran and the revoked oil-export waiver drove WTI up 5.1% to $74 and Brent to $78. As long as the Strait of Hormuz stays a live headline, crude carries an inflation premium that pressures the fuel-sensitive parts of the market and complicates the Fed’s path.
- Split tape, no confirmation — The Dow fell 1.09% and the Russell 0.30% while the Nasdaq rose 0.20%, and the VIX jumped 8.56%. When the indexes disagree and volatility spikes, the move isn’t confirmed. A green screen on one index while breadth and fear point the other way is the textbook no-alignment setup.
- Hawkish Fed meets rising oil — The June minutes showed nine of nineteen projecting another hike and Chair Warsh withholding his dot. An oil-driven inflation scare stacked on top of a hawkish committee is the cleanest threat to the rate-cut hopes still priced into this market.
Frequently Asked Questions
How did the S&P 500 close today?
On Wednesday, July 8, 2026, the S&P 500 closed at 7,482.71 (-0.28%), with the VIX at 17.51. The tape that reclaimed 7,500 on Monday spent Wednesday giving it all back, and the catalyst came from outside the market entirely.
What drove the market today?
OIL SHOCK — US STRIKES IRAN, TRUMP SAYS DEAL IS ‘OVER,’ CRUDE SURGES 5%+ (Day) — After US forces struck Iran late Tuesday over Strait of Hormuz vessel attacks, President Trump said the interim deal was ‘over’ and the Treasury revoked Iran’s oil-export waiver. WTI jumped 5.1% to $74.04 and Brent to $78.10, sending energy up and fuel-sensitive names down hard.
What levels matter for tomorrow?
S&P 500 7,500 — THE PIVOT, LOST FROM ABOVE. Reclaimed Monday, surrendered today with a 7,482 close. Recover and hold 7,500 Thursday and the dip reads as an oil-headline shakeout; stay below and the sellers keep control of the tape. S&P 500 7,540 — the reclaim-and-rejection shelf from this week’s highs. Getting back above it would put the record chase toward the 7,610 zone back on the table. S&P 500 7,400 — lose the 7,480 area and this is the next real support. A break here turns a one-day oil scare into a genuine trend change rather than a headline blip.
How does Meta Trading Club prepare for the next session?
We wrap every session and carry the read forward through the MTC Alignment Engine — bias, level, reaction, confirmation, execution, targets. No alignment, no trade. Learn the full process inside the MTC Incubator.
New to this? Start with the free training.
Learn how we read the market before you risk a dollar — our free education library and ebook break down the fundamentals step by step.
Free education → Get the free ebookThe session’s over. The prep isn’t.
This is how MTC members close each day — wrap what happened, mark the levels, and carry one clean read into tomorrow. If you want to build that habit and qualify your own A+ setups instead of chasing alerts, the MTC Incubator is mentorship and a repeatable process. It’s application-based — see if it’s a fit.
Explore the MTC Incubator → Apply nowSources: Yahoo Finance, CNBC, TheStreet, Investing.com and Benzinga closing data; 24/7 Wall St. sector/mover coverage; CME FedWatch and Federal Reserve FOMC minutes — verified as of 4:30 PM ET July 8, 2026. For educational purposes only. Not financial advice.