The Producer Price Index (PPI) measures the average change over time in the prices that domestic producers receive for their goods and services. Also, it’s a key indicator of inflation at the wholesale level, reflecting price changes from the perspective of the seller rather than the consumer.
The Bureau of Labor Statistics (BLS) releases the Producer Price Index (PPI) report monthly, providing crucial insights into the average change over time in the selling prices received by domestic producers for their goods and services. The report is typically released around the 12th of each month at 8:30 AM Eastern Time. It includes data on various industry classifications, commodity classifications, and the Final Demand-Intermediate Demand system. These offer a comprehensive view of price changes across different sectors. This data is essential for economists, policymakers, and businesses to understand inflationary trends and make informed decisions.
September Producer Price Index
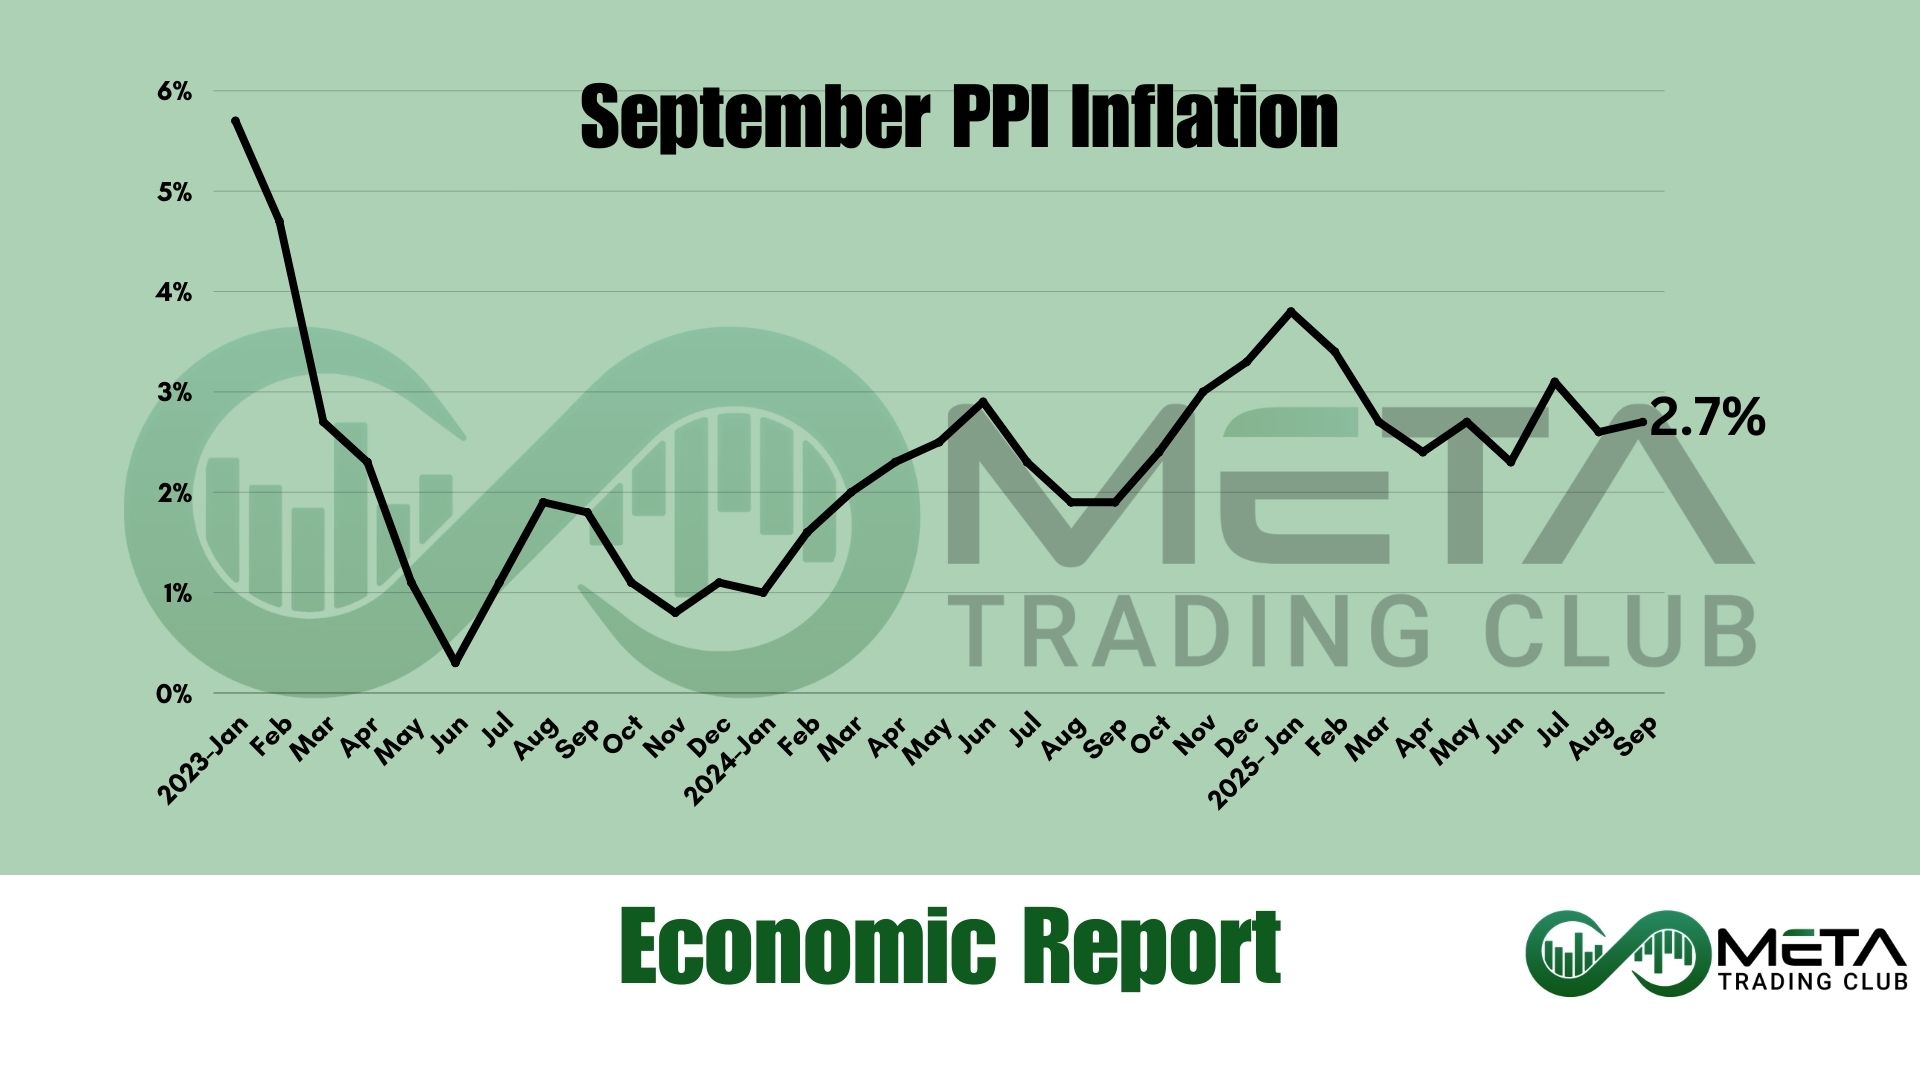
The U.S. Bureau of Labor Statistics reported that the Producer Price Index (PPI) for final demand rose 0.3% in September 2025, seasonally adjusted. This marks a rebound from August’s 0.1% decline and follows July’s stronger 0.8% increase. On an unadjusted basis, producer prices advanced 2.7% over the past 12 months, signaling steady inflationary pressures at the wholesale level.
Goods Inflation
The major September increase came from goods, which climbed 0.9%, the largest monthly gain since February 2024. Energy prices were the standout, rising 3.5%, with gasoline alone surging 11.8% and accounting for 60% of the overall goods increase. Food prices also rose 1.1%, driven by higher meat costs, while fresh and dry vegetables declined by 1.8%. Other notable gains were seen in residential electric power, natural gas liquids, motor vehicles, and ethanol.
Services inflation
In contrast, the index for final demand services was unchanged in September, following a 0.3% decline in August. Transportation and warehousing services rose 0.8%, while services excluding trade, transportation, and warehousing edged up 0.1%. These gains were offset by a 0.2% decline in trade margins, reflecting weaker wholesale and retail pricing power.
Airline passenger services posted a sharp 4.0% increase, highlighting strong demand in travel. Food wholesaling, chemicals wholesaling, deposit services, and furniture retailing also saw price gains. However, machinery and equipment wholesaling fell 3.5%, while margins declined in automobile retailing, apparel and accessories retailing, portfolio management, and long-distance motor carrying.
Core Inflation Trends
Excluding food, energy, and trade services, the core PPI edged up 0.1% in September after a 0.3% rise in August. On a year-over-year basis, core producer prices increased 2.9%, suggesting underlying inflationary pressures remain slightly elevated even as headline inflation steadies.
Impacts of the September PPI Data on Market
September’s PPI report highlights a clear divergence: goods inflation is accelerating, led by energy and food, while services remain subdued. For policymakers and markets, this mix signals that inflationary pressures are concentrated in supply-side costs rather than broad-based demand. With annual PPI holding at 2.7%, the data points to persistent but contained inflation heading into the final quarter of 2025.
SPY traded flat in the pre‑market following the release of the September 2025 Producer Price Index report, reflecting investor caution and a lack of surprise in the data.