An inflation report is published by the government, typically by the central bank, and provides detailed information on current inflation rates. It includes data on price changes for various expenditure categories like housing, food, and transportation, and identifies factors driving inflation.
A Consumer Price Index (CPI) report measures the average change in prices paid by urban consumers for a market basket of goods and services, providing a key indicator of inflation. Published monthly by national statistical agencies, it includes data on categories like food, housing, and transportation. The CPI report helps policymakers, economists, and investors understand economic trends and make informed decisions.
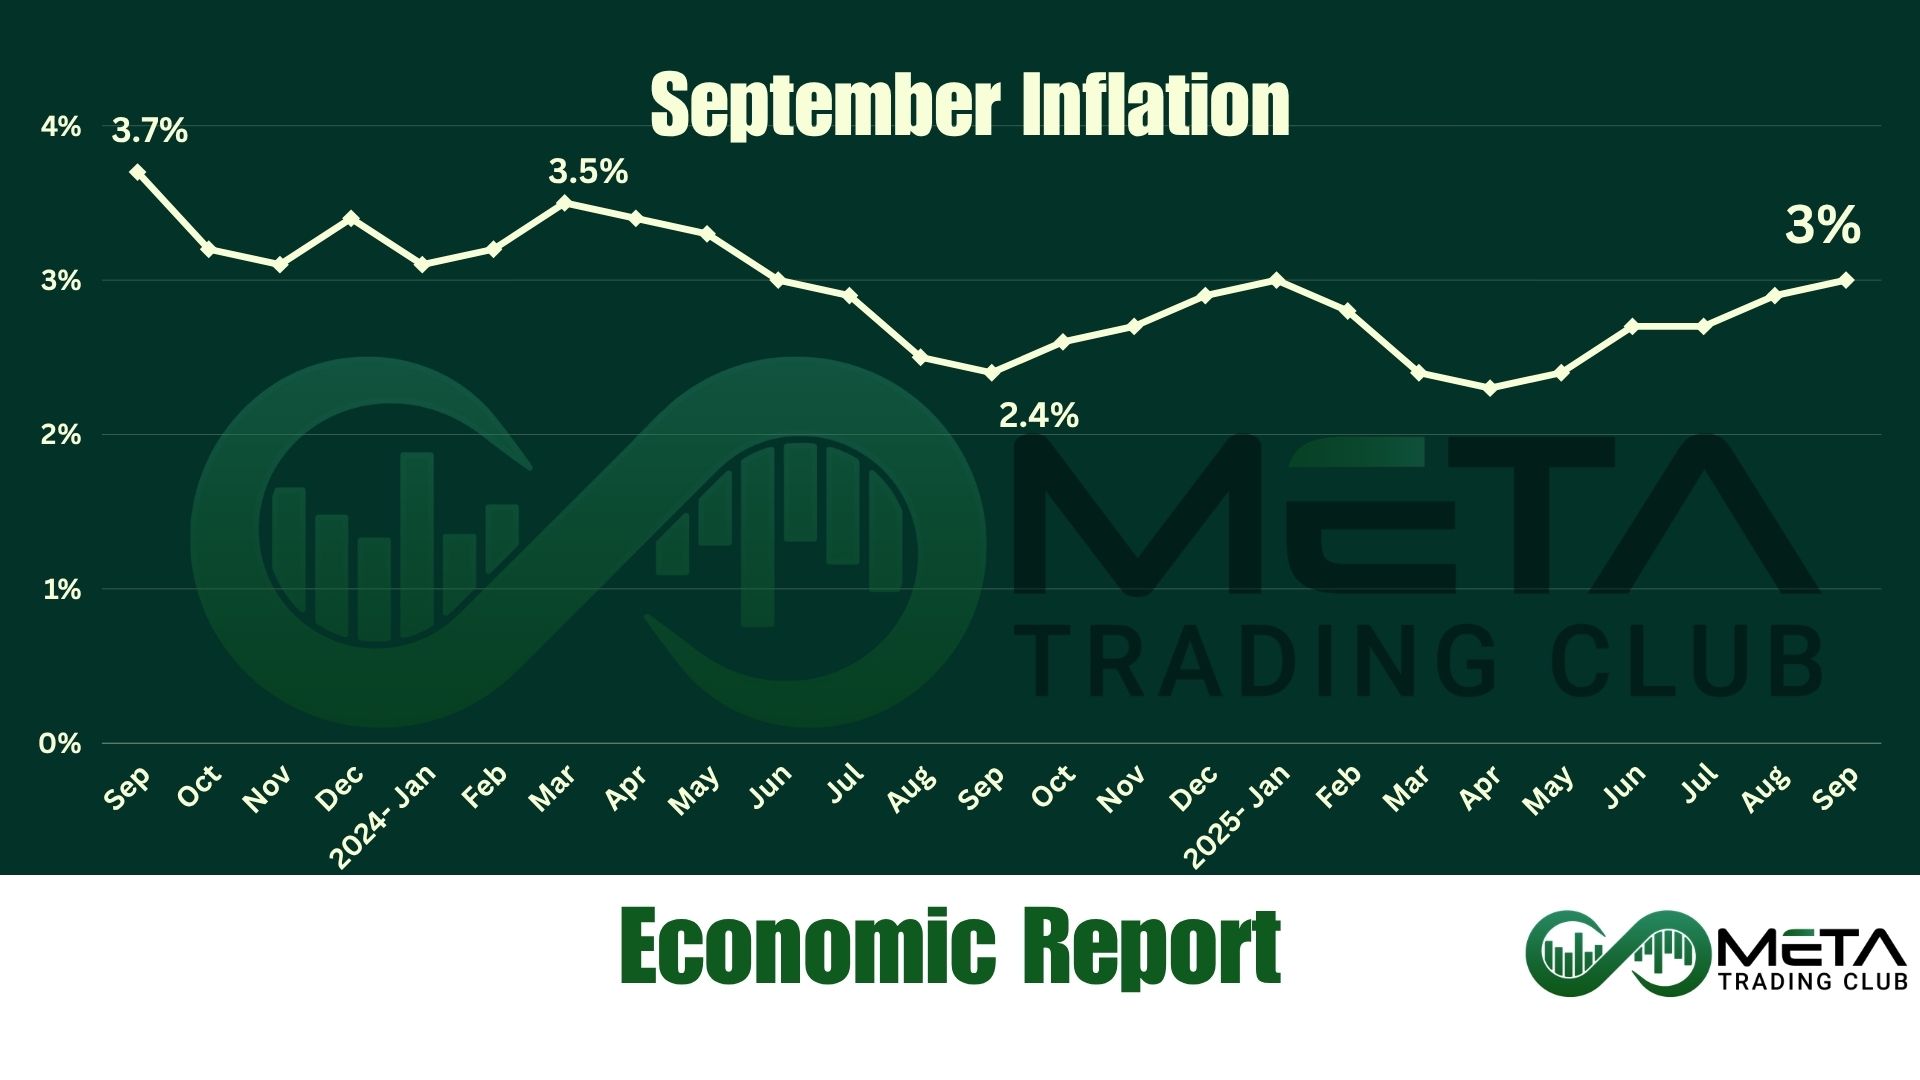
Inflation September 2025
The U.S. Bureau of Labor Statistics released its September 2025 Consumer Price Index (CPI) report. The headline CPI rose 0.3% month-over-month, slightly below August’s 0.4% increase and market expectations. On a year-over-year basis, inflation ticked up to 3%, the highest since January, from 2.9% in August.
Key Drivers of September Inflation
- Energy Prices: The gasoline index surged 4.1% in September, making it the largest contributor to the monthly CPI increase. Overall energy prices rose 1.5% month-over-month. Over the past year, the energy index climbed 2.8%, with electricity up 5.1% and natural gas up a striking 11.7%, while gasoline prices declined 0.5% year-over-year.
- Food Inflation: The food index rose 0.2% in September, down from 0.5% in August. Grocery prices (food at home) increased 0.3%, led by cereals, bakery products, and nonalcoholic beverages (each up 0.7%). Meats, poultry, fish, and eggs rose 0.3%, while dairy products fell 0.5%. Food away from home edged up just 0.1%. Over the past 12 months, the food index rose 3.1%, with notable gains in meats (+5.2%) and beverages (+5.3%).
Sector Highlights
- Medical Care: The medical care index rose 0.2% in September, reversing a 0.2% decline in August. Hospital services and prescription drugs each increased 0.3%, while dental and physician services declined.
- Shelter and Rent: Shelter inflation remains steady, with a 3.6% annual increase. Lodging away from home rose 1.3% in September, while rent and owners’ equivalent rent posted modest monthly gains.
- Durables and Services: Used cars and trucks saw a 5.1% annual increase despite monthly declines. Household furnishings rose 4.1% year-over-year, and recreation services climbed 3.0%.
Core Inflation
The index for all items excluding food and energy rose 0.2% in September, down from 0.3% in the prior two months. Year-over-year, core inflation matched headline inflation at 3%.
Shelter costs rose 0.2%, with owners’ equivalent rent posting its smallest monthly gain since January 2021 (+0.1%). Airline fares jumped 2.7%, while apparel and household furnishings rose 0.7% and 0.4%, respectively. Declines were seen in motor vehicle insurance (-0.4%), used cars and trucks (-0.4%), and communication (-0.2%).
Impacts of September CPI Data on the Market
The September CPI report presents a mixed picture. While headline inflation rose slightly, core inflation eased, suggesting underlying price pressures may be stabilizing. The surge in gasoline prices highlights energy volatility as a key risk, but the moderation in food and shelter costs offers some relief.
SPY surged to a new all-time high following the September CPI report, as softer core inflation and a cooler-than-expected headline fueled investor optimism about potential rate cuts at the next Federal Reserve meeting. The 0.3% monthly CPI increase and a dip in core inflation to 3% (from 3.1%) signaled easing underlying price pressures, boosting confidence that the Fed may pivot toward a more accommodative stance sooner.
This dovish hope in rate expectations triggered broad buying across equities, with interest-rate sensitive sectors like tech and consumer discretionary leading the rally.