The Personal Consumption Expenditures (PCE) Price Index is a key inflation gauge used by the Federal Reserve to assess the prices of goods and services consumed by households. Unlike the Consumer Price Index (CPI), the PCE adjusts for changing consumer behavior, reflecting how people shift spending as prices change.
The core PCE, which excludes volatile food and energy prices, is especially watched by policymakers to understand underlying inflation trends. It’s considered a comprehensive measure of inflation and guides decisions on interest rates and monetary policy.
March PCE Price Index
The Bureau of Economic Analysis reported the March 2025 estimates for personal income, disposable income, and personal consumption expenditures, indicating steady economic activity.
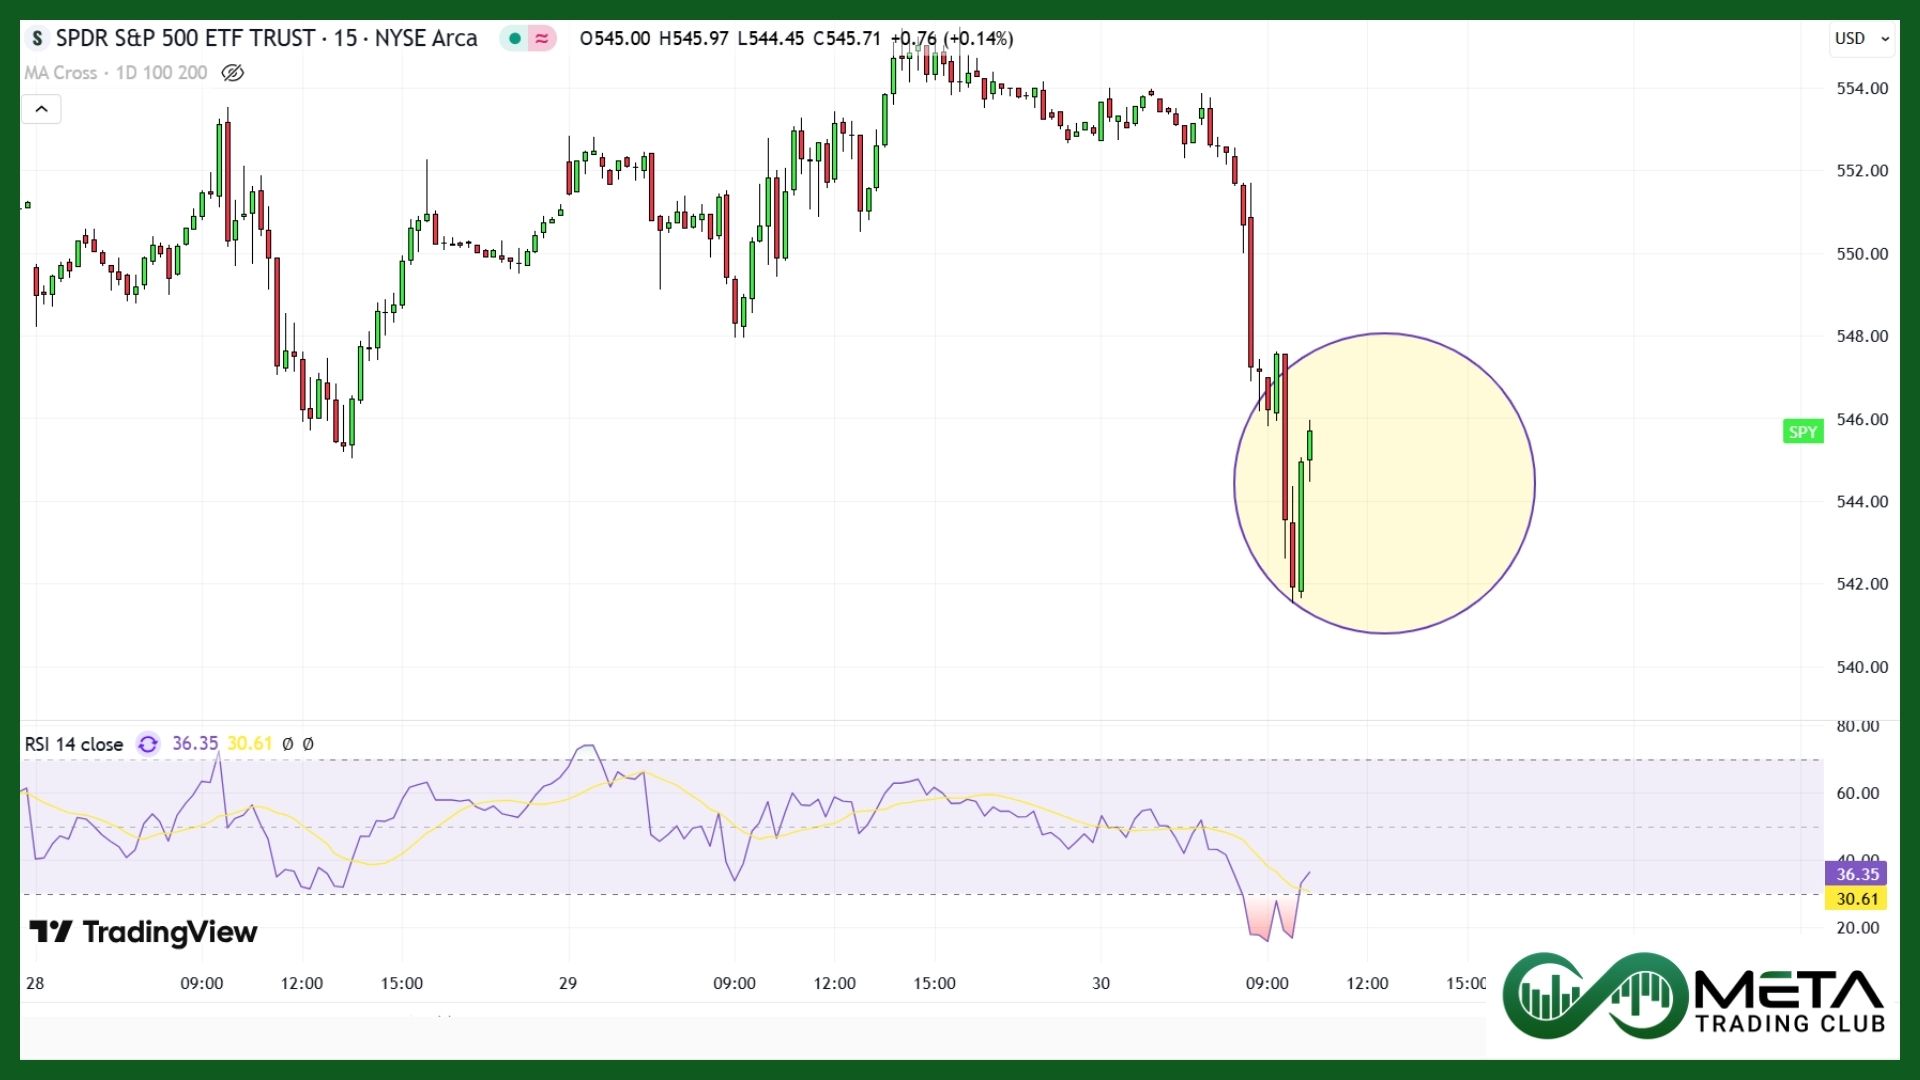
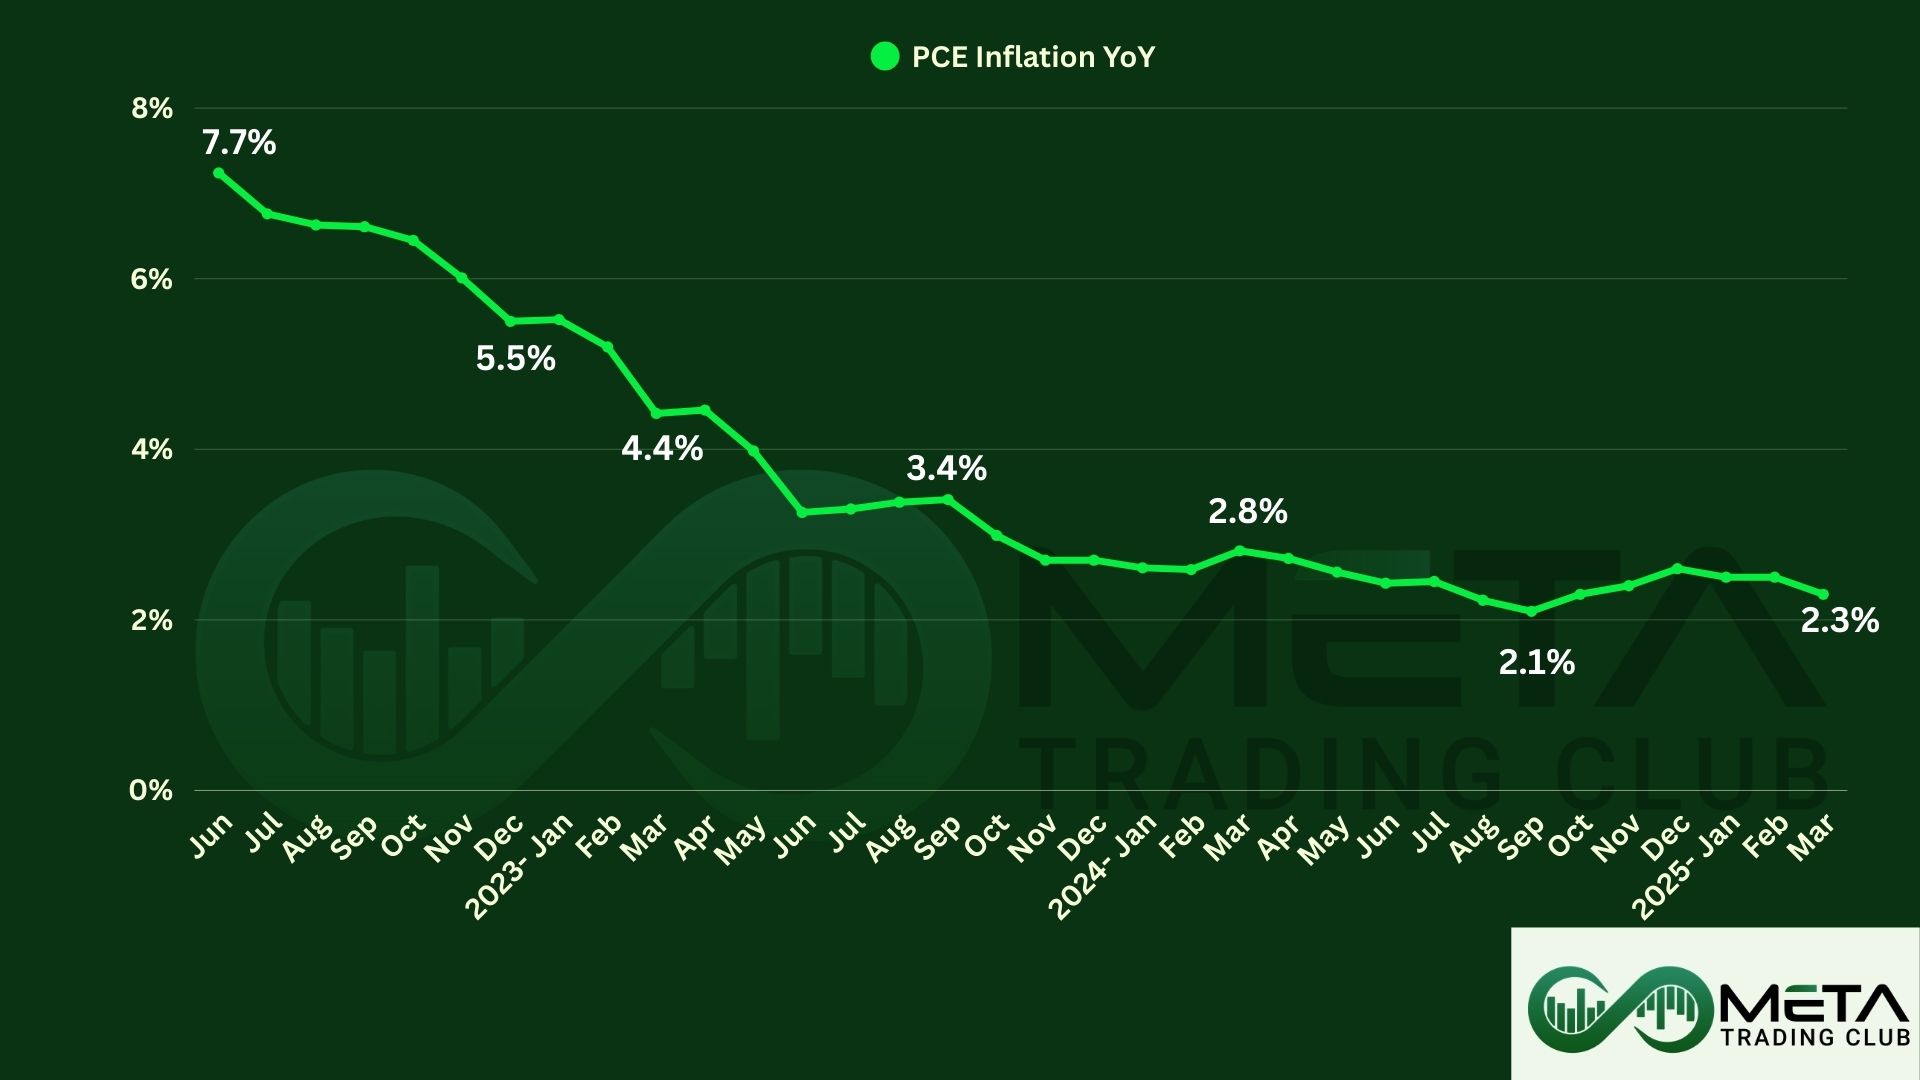
In March 2025, U.S. consumer prices stayed flat compared to February, marking the smallest change in ten months.
Also, annual inflation eased to 2.3%, and core inflation, excluding food and energy, slowed to 2.6%.
Income and Outlays Overview
- Personal Income: Increased by $116.8 billion, reflecting a 0.5% monthly growth rate. The primary contributors were compensation and proprietors’ income.
- Disposable Personal Income (DPI): Rose by $102.0 billion, a 0.5% increase, highlighting resilient income trends after personal current taxes.
- Personal Consumption Expenditures (PCE): Expanded by $134.5 billion, representing a 0.7% growth. Goods spending increased by $54.5 billion, while services spending grew by $79.9 billion.
Outlays and Savings
- Personal outlays climbed $136.6 billion, driven by broader spending categories, including PCE and interest payments.
- Personal savings amounted to $872.3 billion, with a savings rate of 3.9%, underscoring a balance between spending and saving behaviors.
Price Index Trends
- Month-to-Month Changes: The PCE price index showed a minor decrease of less than 0.1%, while the core index (excluding food and energy) rose by less than 0.1%.
- Year-over-Year Changes: Compared to March 2024, the PCE price index increased by 2.3%, and the core index grew by 2.6%, reflecting moderate inflation levels.
Impacts of March PCE Data
The March 2025 Personal Consumption Expenditures (PCE) data highlights steady economic activity. Personal income grew by 0.5%, with disposable income increasing by the same rate. Consumer spending rose by 0.7%, driven by increased expenditures on both goods and services. However, the personal saving rate fell to 3.9%, reflecting a higher focus on spending.
Inflation showed moderate trends, with the PCE price index rising by 2.3% year-over-year, and the core index, excluding food and energy, increasing by 2.6%. Month-to-month, price changes were minimal. This data indicates resilience in consumer behavior amid controlled inflation, supporting a stable economic outlook.