The Personal Consumption Expenditures (PCE) Price Index is a key inflation gauge used by the Federal Reserve to assess the prices of goods and services consumed by households. Unlike the Consumer Price Index (CPI), the PCE adjusts for changing consumer behavior, reflecting how people shift spending as prices change.
Core PCE excludes food and energy prices. Policymakers closely monitor it to understand inflation trends. It is considered a comprehensive measure of inflation. This helps guide decisions on interest rates and monetary policy.
By focusing on core PCE, the Federal Reserve can assess economic stability and inflation risks more effectively.
June PCE Price Index
In June 2025, personal income in the United States rose by $71.4 billion, marking a 0.3% increase at a monthly rate, according to the U.S. Bureau of Economic Analysis. Disposable personal income (DPI), which accounts for income after taxes, also increased by 0.3%, or $61.0 billion. Personal consumption expenditures (PCE), spending by individuals on goods and services, went up by $69.9 billion, matching a 0.3% monthly increase.
Personal outlays, which include PCE, personal interest payments, and current transfer payments, increased by $69.5 billion in June. Meanwhile, personal savings amounted to $1.01 trillion, with a saving rate of 4.5%, calculated as a percentage of disposable personal income.
The growth in current-dollar personal income was mainly driven by increased compensation and higher government social benefits to individuals. Within PCE, spending on services rose by $40.1 billion, and spending on goods increased by $29.9 billion, contributing to the overall rise in consumer activity.
The PCE price index, which measures changes in the prices paid by consumers, rose 0.3% from the previous month. When excluding volatile categories such as food and energy, the core PCE price index also increased by 0.3%.
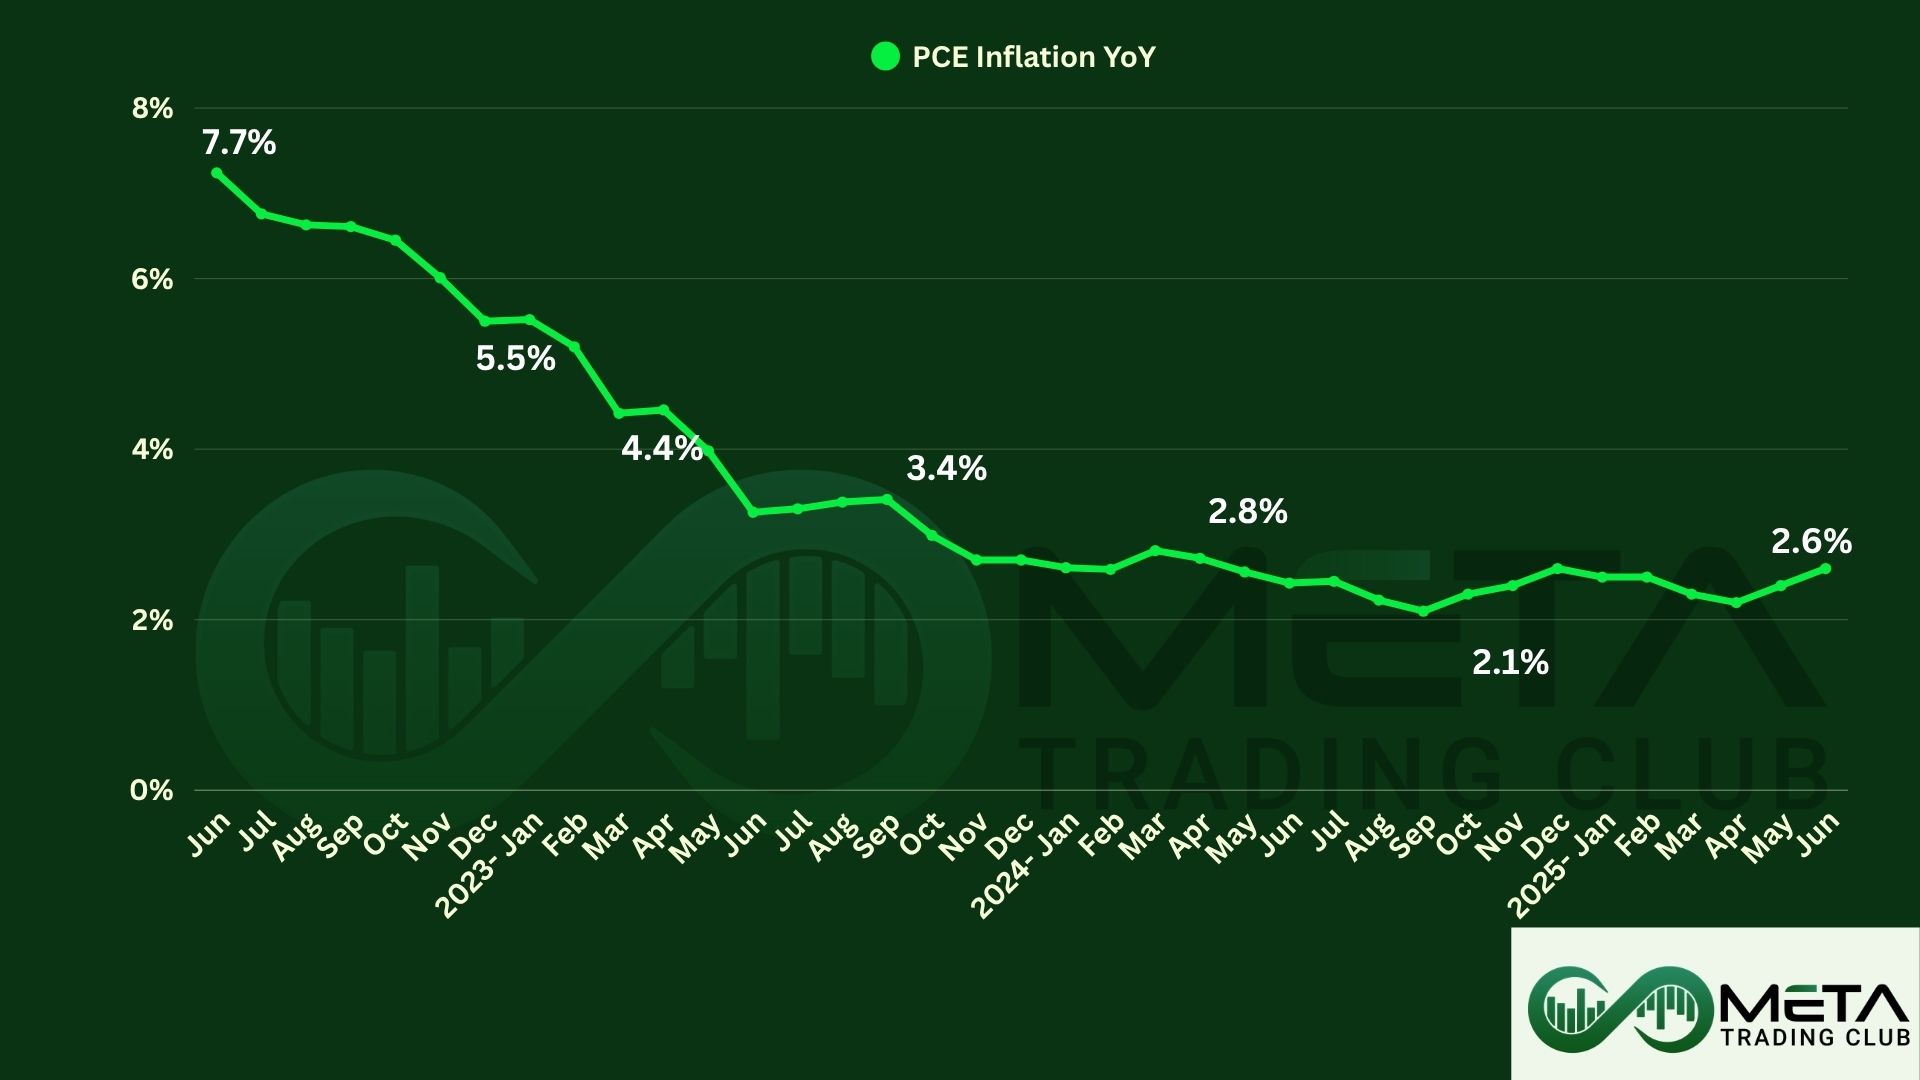
Compared to June of the previous year, the overall PCE price index grew by 2.6%, while the core index increased by 2.8%.
From May to June 2025, several personal income indicators showed modest increases. Current-dollar personal income and disposable personal income both rose by 0.3%. However, real disposable income, which adjusts for inflation, remained flat.
Current-dollar PCE also increased by 0.3%, while real PCE rose slightly by 0.1%. These figures reflect steady, but cautious, growth in consumer spending and income levels.
Impacts of June PCE Data
The June PCE report showed inflation continuing to run above the Federal Reserve’s target, with both headline and core PCE rising 0.3% for the month. Core PCE held steady at 2.8% year-over-year, largely driven by trade-related cost pressures. This dampened market expectations for a rate cut.
Investors responded cautiously, viewing the data as a sign the Fed may keep rates unchanged. Overall, the report underscored persistent inflation and shaped a more restrained market outlook.