An inflation report is published by the government, typically by the central bank, and provides detailed information on current inflation rates. It includes data on price changes for various expenditure categories like housing, food, and transportation, and identifies factors driving inflation.
A Consumer Price Index (CPI) report measures the average change in prices paid by urban consumers for a market basket of goods and services, providing a key indicator of inflation. Published monthly by national statistical agencies, it includes data on categories like food, housing, and transportation. The CPI report helps policymakers, economists, and investors understand economic trends and make informed decisions.
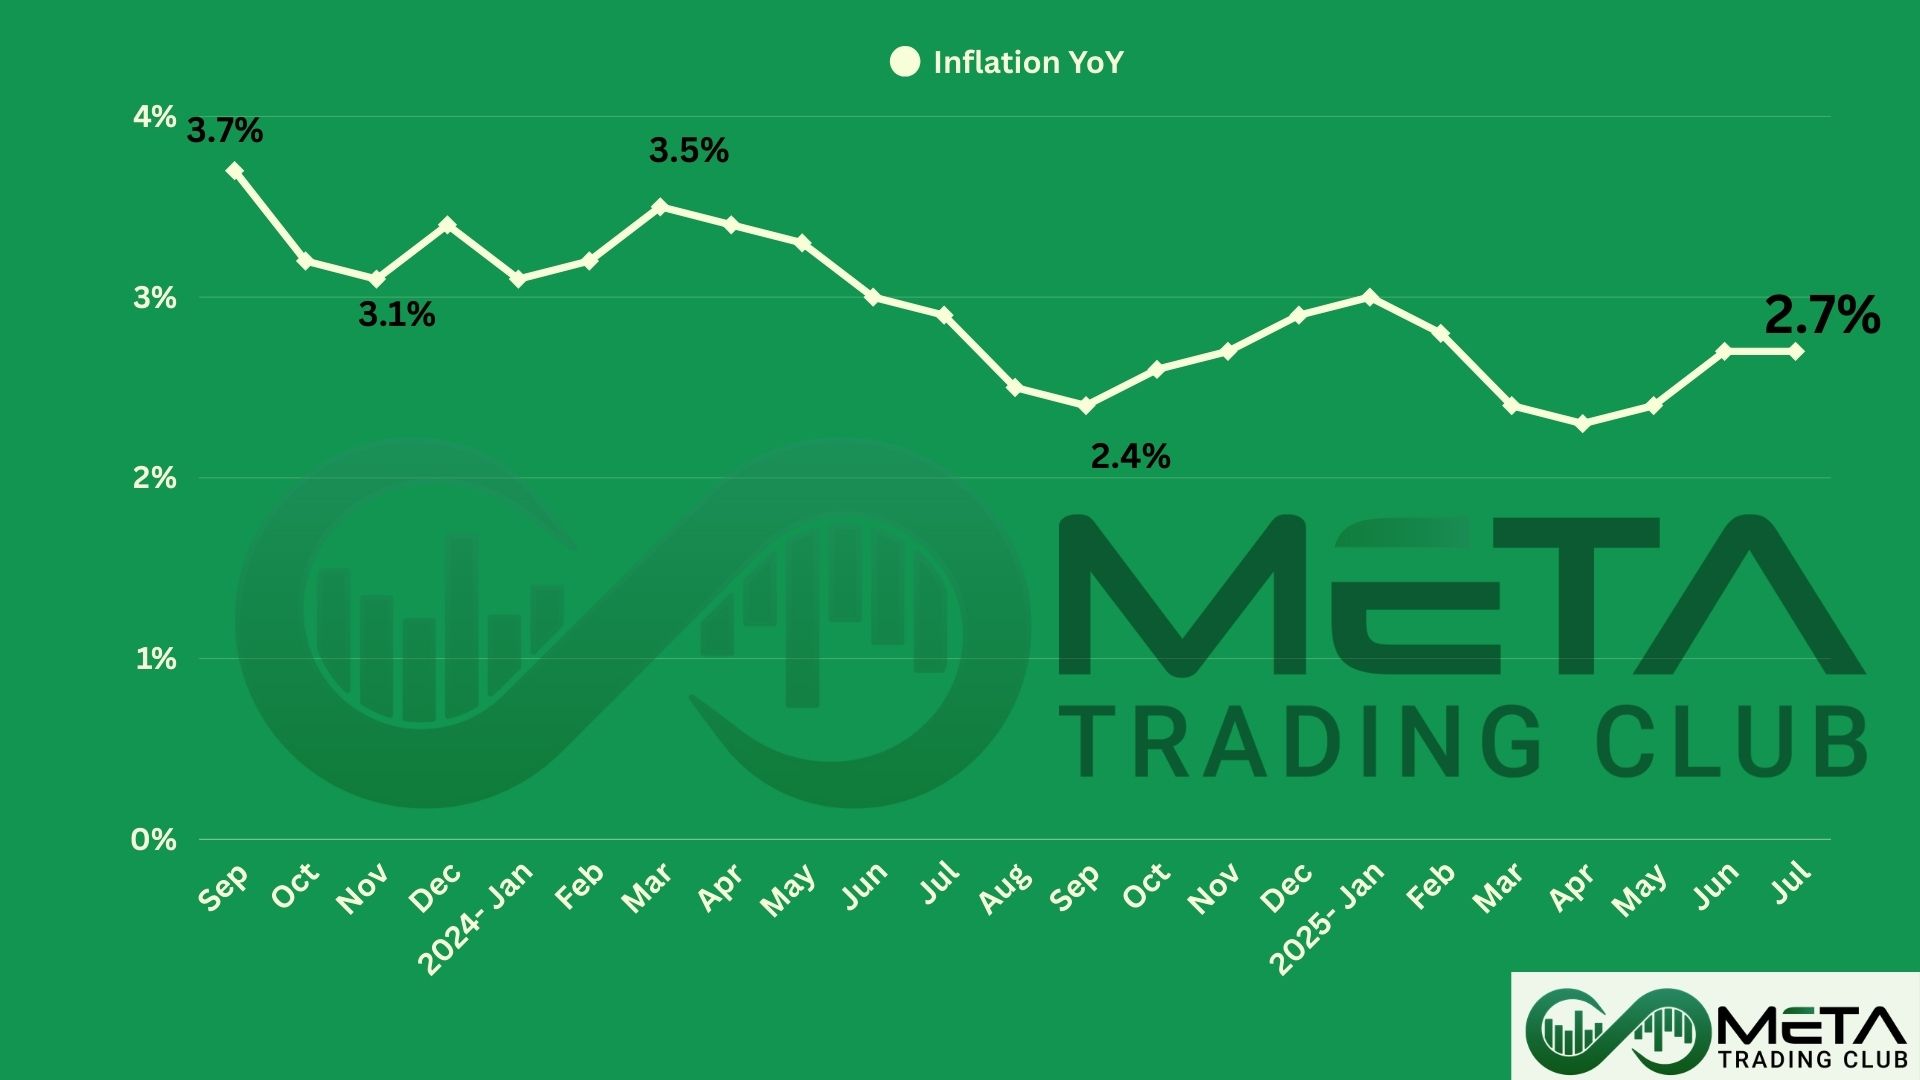
Inflation July 2025
In July, consumer prices in the U.S. rose by 0.2% compared to the previous month, slightly less than June’s 0.3% increase. Over the past year, overall prices went up by 2.7%. The biggest contributor to the monthly rise was housing costs, which increased by 0.2%.
Food Prices
Food prices stayed flat in July after rising for two months. Grocery prices dipped slightly, with the food at home index down 0.1%. Out of six major grocery categories, two went up, three went down, and one stayed the same. Notably:
Eating out became more expensive, with food away from home up 0.3%. Full-service meals rose 0.5%, and limited-service meals increased 0.1%.
Over the past year:
- Food at home prices rose 2.2%, with eggs up a striking 16.4%.
- Meats, poultry, fish, and eggs rose 5.2%, and nonalcoholic beverages rose 3.6%.
- Food away from home increased 3.9%, including a 4.4% rise for full-service meals.
Energy Prices
Energy prices declined by 1.1% in July, following a 0.9% increase in June. Gasoline prices dropped 2.2% for the month, while electricity fell slightly by 0.1% and natural gas decreased by 0.9%.
Over the past 12 months:
- Overall energy prices fell 1.6%.
- Gasoline plunged 9.5%, and fuel oil dropped 2.9%.
- In contrast, electricity rose 5.5%, and natural gas surged 13.8%.
All Items Less Food and Energy
Core inflation, which excludes food and energy, rose by 0.3% in July, following a 0.2% increase in June.
- Shelter costs rose 0.2%, with rent and owners’ equivalent rent both up 0.3%.
- Lodging away from home fell 1.0%.
Healthcare saw notable increases:
- Medical care rose 0.7%, including a 2.6% jump in dental services.
- Hospital services increased 0.4%, while prescription drugs fell 0.2%.
Other increases:
- Airline fares surged 4%.
- Recreation, household furnishings, and personal care all rose 0.4%.
- Used cars and trucks went up 0.5%.
- New vehicles stayed flat, and communication services fell 0.3%.
Over the past 12 months, the index for all items less food and energy rose 3.1%. Shelter costs increased 3.7%, medical care rose 3.5%, household furnishings and operations climbed 3.4%, motor vehicle insurance surged 5.3%, and recreation was up 2.4%.
Impacts of July CPI Data on Market
The July CPI report showed inflation holding steady at 2.7% annually, with core inflation rising to 3.1%, its highest level in six months. While headline inflation came in slightly below expectations, the uptick in core prices suggests underlying price pressures remain strong, especially in areas like shelter, medical care, and transportation.
Despite the hotter inflation data, the stock market responded positively, with the SPY rising 0.6%. Investors seem to believe that the Federal Reserve may still cut interest rates soon, as signs of a slowing economy are becoming more apparent. So even though prices are climbing, the market is optimistic that the Fed will take action to support growth.