The Producer Price Index (PPI) measures the average change over time in the prices that domestic producers receive for their goods and services. Also, it’s a key indicator of inflation at the wholesale level, reflecting price changes from the perspective of the seller rather than the consumer.
The Bureau of Labor Statistics (BLS) releases the Producer Price Index (PPI) report monthly, providing crucial insights into the average change over time in the selling prices received by domestic producers for their goods and services. The report is typically released around the 12th of each month at 8:30 AM Eastern Time. It includes data on various industry classifications, commodity classifications, and the Final Demand-Intermediate Demand system. These offer a comprehensive view of price changes across different sectors. This data is essential for economists, policymakers, and businesses to understand inflationary trends and make informed decisions.
April Producer Price Index
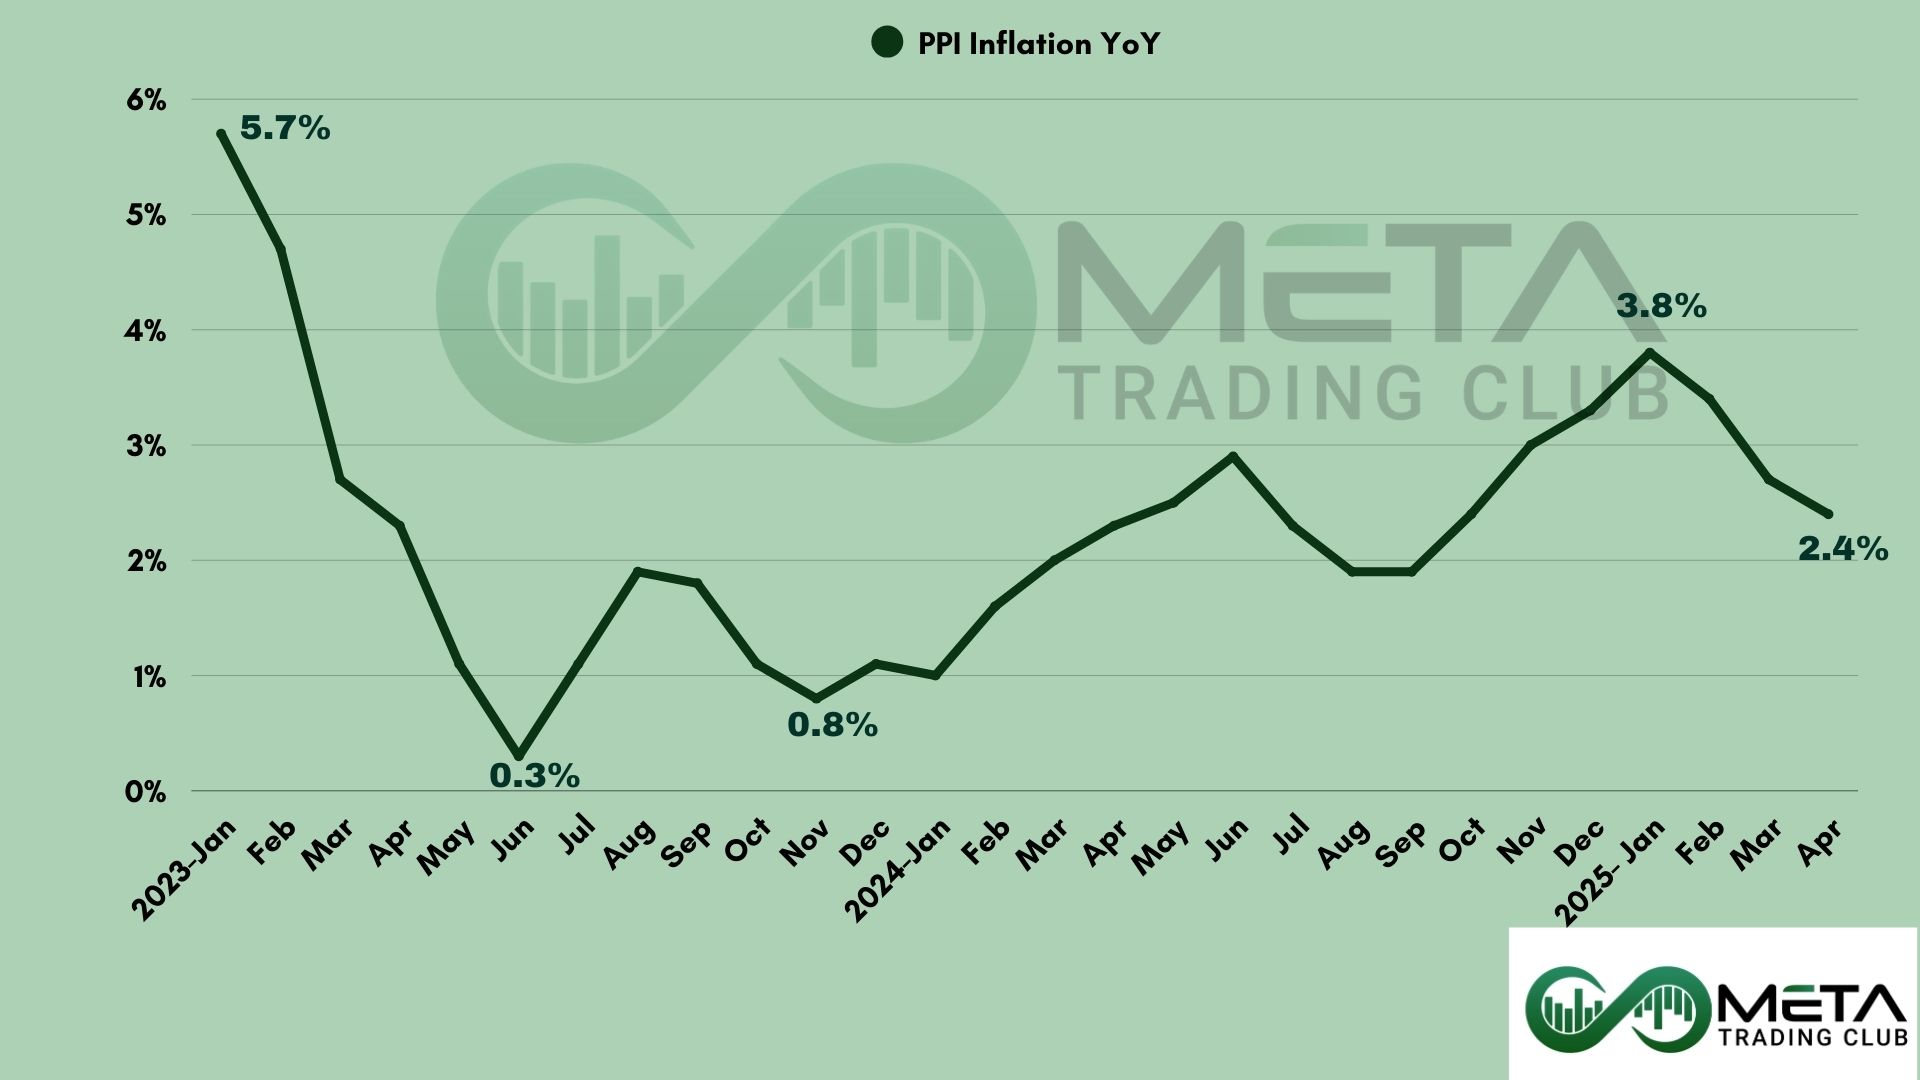
The U.S. Bureau of Labor Statistics reported that the Producer Price Index (PPI) for final demand fell by 0.5% in April 2025, marking the first decline since October 2023. This follows unchanged prices in March and a 0.2% increase in February. On a year-over-year basis, final demand prices rose 2.4%.
Key Drivers of the Decline
- Final Demand Services: Prices dropped 0.7%, the largest decrease since the index began in 2009. Most of this decline came from trade services, which fell 1.6%, affecting wholesalers and retailers.
- Final Demand Goods: Prices remained unchanged in April, after a 0.9% drop in March. While non-food and non-energy goods saw a 0.4% increase, prices for food fell 1%, and energy prices declined 0.4%.
Detailed Sector Trends
- Machinery and Vehicle Wholesaling: Margins fell 6.1%, contributing to over 40% of the services price drop.
- Other Declining Sectors: Portfolio management, food and alcohol wholesaling, system software publishing, traveler accommodations, and airline passenger services also saw price reductions.
- Rising Costs: Outpatient care, furniture retailing, and inpatient care saw price increases. Among goods, general-purpose machinery (+1.1%), residential electricity, vegetables, non-electronic cigarettes, and natural gas had price gains.
- Sharpest Drop: Chicken egg prices plunged 39.4%, marking one of the steepest declines in the food sector.
Inflation Trends
- The core PPI, excluding food, energy, and trade services, fell 0.1% in April, its first drop since April 2020.
- Over the past 12 months, core PPI rose 2.9%, indicating moderate inflation pressures.
Impacts of April PPI Data on Market
The unexpected drop in producer prices may signal weaker demand in services, while stable goods prices suggest mixed inflation trends. traders will closely monitor upcoming reports, especially given ongoing tariff concerns and economic uncertainty.
The services sector saw the biggest impact, with prices dropping 0.7%, mainly due to trade services (-1.6%). Machinery and vehicle wholesaling fell 6.1%, while transportation and warehousing declined 0.4%. Other affected areas include portfolio management, food and alcohol wholesaling, software publishing, and travel accommodations, all seeing price drops.
The stock market may worry that these declines signal an economic slowdown, which could affect traders’ confidence.