The Producer Price Index (PPI) measures the average change over time in the prices that domestic producers receive for their goods and services. Also, it’s a key indicator of inflation at the wholesale level, reflecting price changes from the perspective of the seller rather than the consumer.
The Bureau of Labor Statistics (BLS) releases the Producer Price Index (PPI) report monthly, providing crucial insights into the average change over time in the selling prices received by domestic producers for their goods and services. The report is typically released around the 12th of each month at 8:30 AM Eastern Time. It includes data on various industry classifications, commodity classifications, and the Final Demand-Intermediate Demand system. These offer a comprehensive view of price changes across different sectors. This data is essential for economists, policymakers, and businesses to understand inflationary trends and make informed decisions.
July Producer Price Index
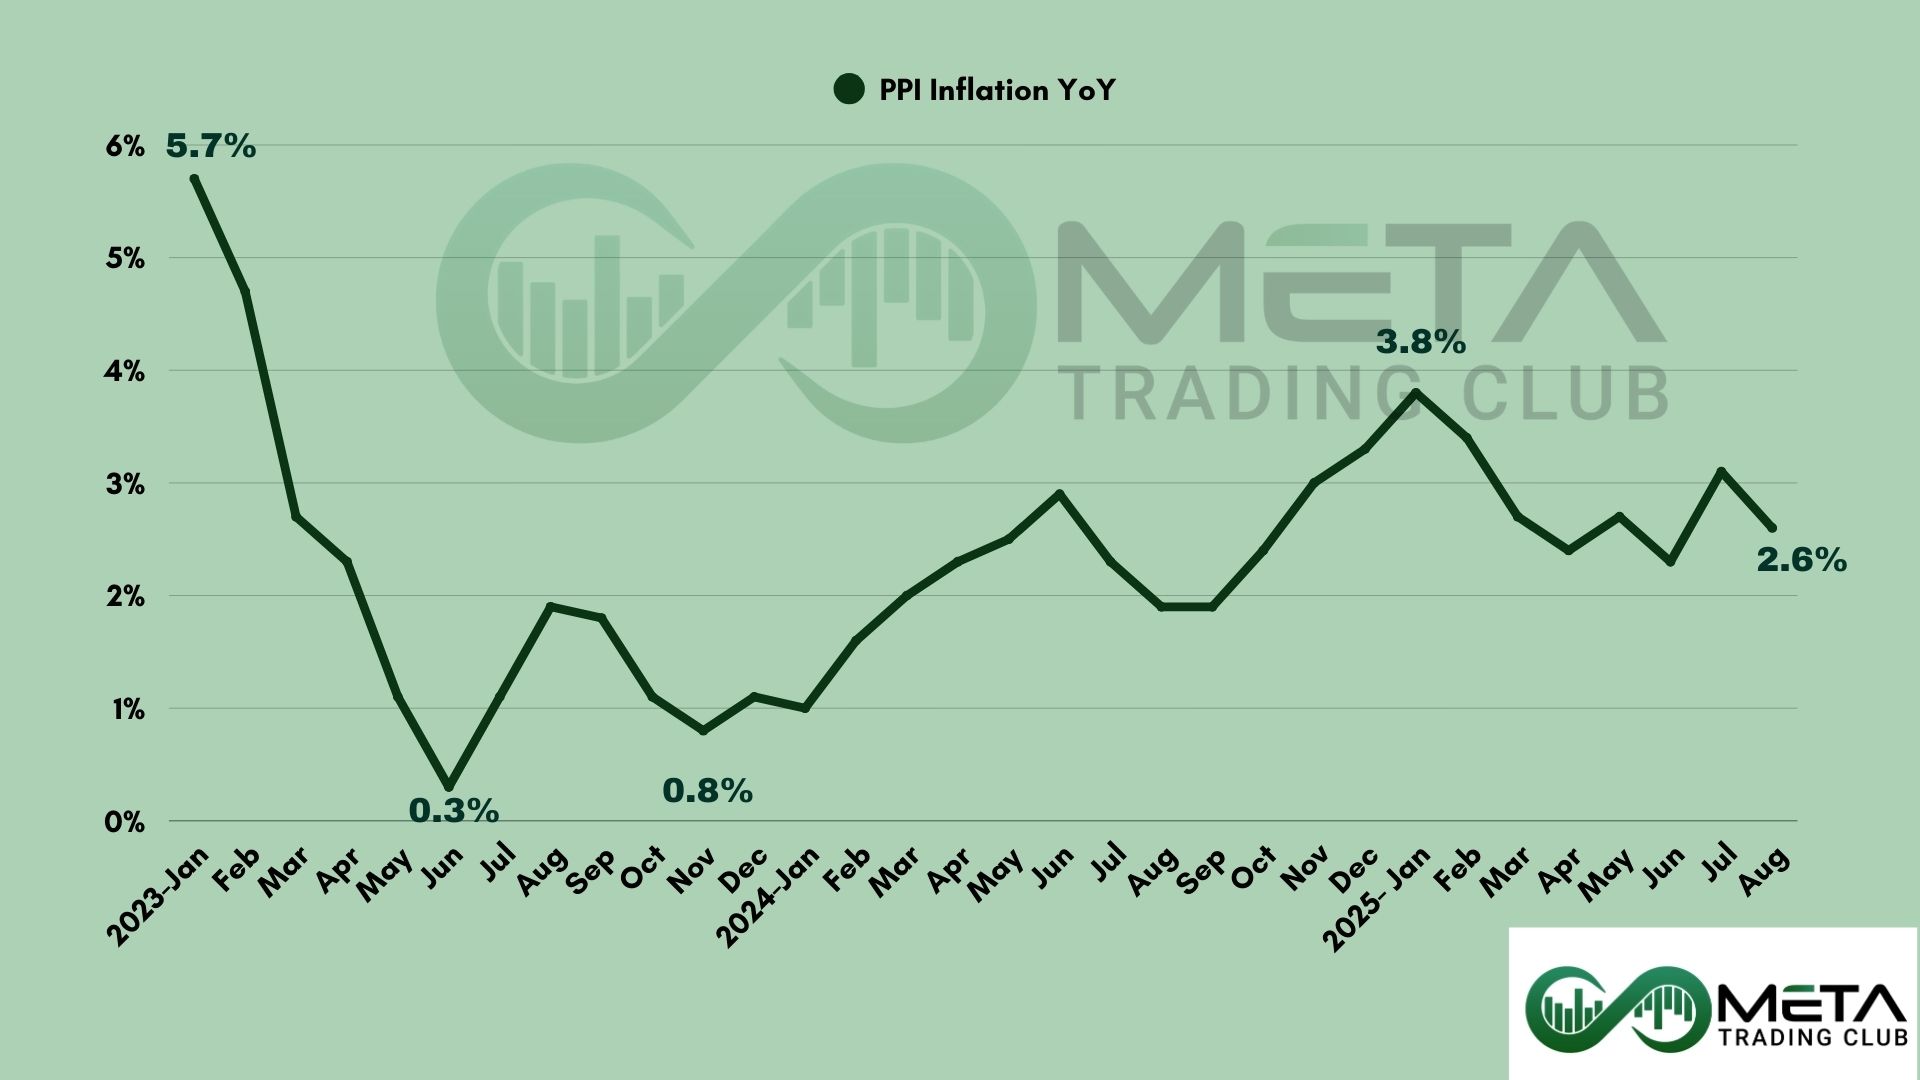
The U.S. Bureau of Labor Statistics reported that the Producer Price Index (PPI) for final demand fell by 0.1% in August. This follows a 0.7% increase in July and a 0.1% rise in June.
On a year-over-year basis, final demand prices rose 2.6%, indicating a slower pace of wholesale inflation.
Services
The decline was driven by a 0.2% drop in service prices, the largest since April. This was mainly due to a 3.9% fall in margins for machinery and vehicle wholesaling. This was a long with declines in equipment, chemicals, furniture, food and alcohol retailing, and data services.
However, prices rose for portfolio management, truck freight, and apparel wholesaling.
Goods
In contrast, goods prices edged up 0.1%, continuing a four-month upward trend. Tobacco products led the increase with a 2.3% jump, followed by gains in beef, poultry, electronics, and electric power.
Energy prices fell 0.4%, with natural gas down 1.8%, and declines also seen in vegetables, eggs, and copper scrap.
Core PPI
Core PPI (excluding food, energy, and trade Services) rose 0.3% in August, its fourth straight monthly gain.
Over the past year, core prices climbed 2.8%, the highest annual increase since March 2025.
Impacts of August PPI Data on Market
The unexpected 0.1% decline in producer prices for August signaled a potential cooling in wholesale inflation, easing concerns over rising input costs for businesses. This marked the first monthly drop in four months and came in well below forecasts, reinforcing hopes that inflationary pressures are stabilizing.
As a result, investors are increasingly optimistic that the Federal Reserve may consider interest rate cuts sooner than expected, which typically supports equity markets.
Major indexes such as the S&P 500 and Nasdaq posted pre-market gains, led by tech and consumer sectors that benefit from lower borrowing costs and improved margins. The data added momentum to a broader market rally, with traders recalibrating expectations around monetary policy and growth.
The SPDR S&P 500 ETF (SPY) surged to a record high of $654 on September 10, 2025, underscoring strong investor confidence and bullish market sentiment. This breakout was largely driven by cooling inflation signals, particularly the unexpected 0.1% drop in August’s Producer Price Index (PPI), which eased concerns over rising input costs.